Stata: One Program for Many Disciplines
Read a summary using the INOMICS AI tool
By Sofia Izquierdo-Sanchez
University of Huddersfield
There was a time when engineers and social scientists thought their fields were too different to combine their research (Black et al., 2010). Not that many years ago doctors and health researchers thought economists could not help them improve medical services; and of course which economist would have dared to claim that something they were working on could directly save people’s lives? (See for example: Jones, 1994; Philipson, 2001). Likewise, most neuroscientists never thought that their work could be used to explain consumer behaviour (Camerer et al., 2005), and mathematicians never thought that psychology could ever be related to their discipline (Ma and De la Torre, 2016).
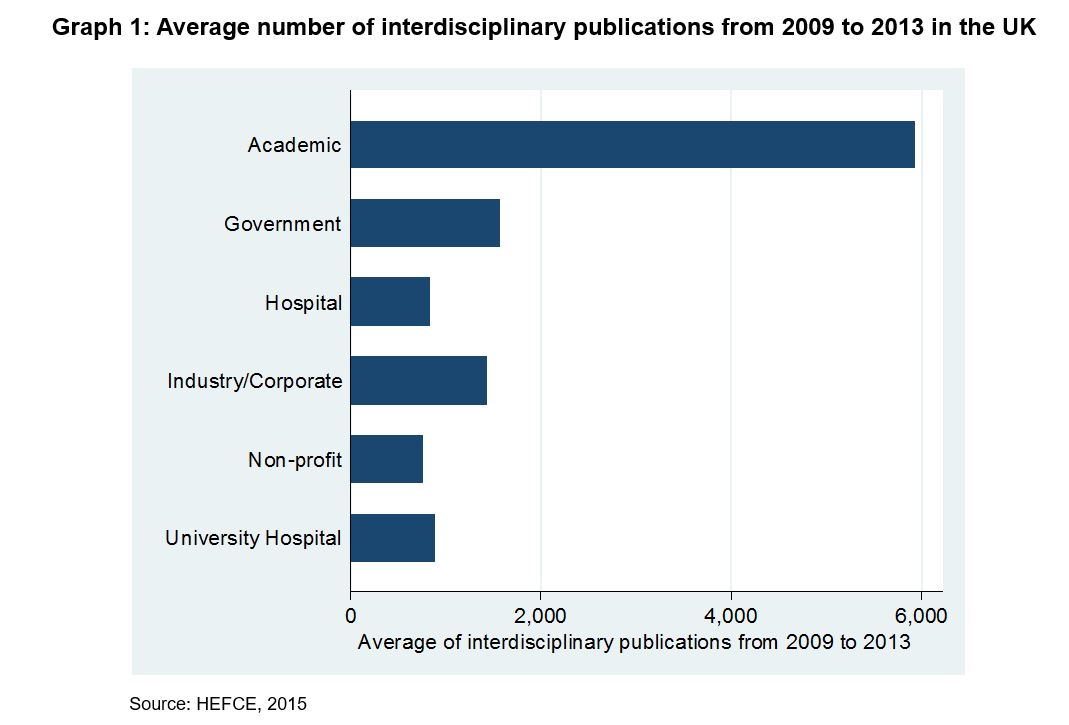
Now those times are gone and interdisciplinary research is highly recognised as a means to achieving successful and rich research outputs (HEFCE, 2015). This is reflected in the number of research centres that continue to release funding opportunities with a particular attention on interdisciplinary outputs within and across disciplines. To mention some examples: The National Science Foundation (NSF), Economic and Social Research Council (ESRC), the Arts and Humanities Research Council (AHRC), the Centre for Copyright and New Business Models in the Creative Economy (CREATe), or the European Union (EU) research and innovation programme Horizon 2020. These funding opportunities and the final recognition of interdisciplinary research in the most recent Research Excellence Framework (REF), which is so important to rank the research quality of UK institutions, have clearly increased collaboration across disciplines, not just in the academic environment but also in other institutions such as hospitals or government centres (Graph 1). In general, European countries have the highest percentage of international collaborative publications (HEFCE, 2015).
A world with interdisciplinary collaboration may look easy and simple, but this is far from reality. Combining disciplines is risky and difficult. How can, for example, health researchers and economists work together? How can they understand one another when talking about numbers or diseases? For this understanding to happen they need a common instrument to work with, an easy and friendly tool that both disciplines can interpret, and one which can combine, in this example, disease information and data to draw conclusions in a manageable yet sophisticated format at the same time, and so satisfy both sides.
One key breakthrough has been the development of statistical software and tools such as Stata, Eviews and GAUSS, to name but a few, which in recent years have enabled statisticians, economists and mathematicians to translate and present their work in a way which is understandable and useful for researchers in other disciplines. Such tools have been developed to the stage that they can be accessible enough and easy enough to learn that researchers and professionals without advanced statistical training can learn to use them with relatively little training, as a useful complement to their existing research tools.
Research papers such as: Archer and Lemeshow, 2006; Norton et al., 2004; or Ho and Pennington-Cross, 2006 have shown that Stata is currently the most popular of such tools, and for many researchers acts as a language which different disciplines in effect use to communicate with each other (many more articles can be found as examples). Stata emerged in 1985 and since then has cemented its place in the market as a fast, accurate, and user-friendly statistical package which covers the necessities of a wide range of disciplines. From the simplest statistical analysis and graphs, to the most advanced econometric analysis, Stata is widely use in the areas of economics, political science, sociology, health, finance, etc. (https://www.stata.com).
Tools like Stata have contributed to a major shift in the academic landscape in Europe and around the world, helping researchers in all disciplines to benefit from solid statistical analysis and supporting researchers in economics, statistics and mathematics to cooperate with professionals in fields that traditionally might have avoided detailed quantitative analysis in research projects. If you have used Stata or other tools in a cross-discipline project, please share your experiences in the comments below. If you have not, then perhaps it is time to try and strengthen your own research through cooperation with your peers in other disciplines!
References
-
- Research Assistant / Technician Job
- Posted 2 weeks ago
Research Assistant: Foreign and Defense Policy; Demographics and Political Economy
At American Enterprise Institute in Washington, United States
-
- Assistant Professor / Lecturer Job, Postdoc Job
- Posted 3 weeks ago
Assistant professorship(s) in the fields of accounting and finance at Department of Business Development and Technology
At Aarhus University in Herning, Denmark
-
- Postdoc Job
- Posted 1 week ago
Postdoctoral Research Fellow or Social Science Research Scholar at Stanford (USA) or Heidelberg University (Germany)
At Stanford University in Stanford, United States
Currently trending in United States
Related Items


Featured Announcements


Upcoming Deadlines
- Jul 26, 2026
- Jul 26, 2026
- Jul 29, 2026
- Jul 31, 2026
- Jul 31, 2026


