Economics Terms A-Z
Demand Curve
Read a summary or generate practice questions using the INOMICS AI tool
A demand curve shows the relationship between the price of a good and the quantity of the good demanded, either by an individual or by all participants in the market. Demand curves are downward-sloping for most items as greater quantities are demanded at lower prices.
The following graph shows the demand curve for a typical good or service. As the item’s price (vertical axis) falls from pD1 to pD2 to pD3, the quantity demanded (horizontal axis) rises from qD1 to qD2 to qD3, and vice versa. As price rises, quantity demanded falls.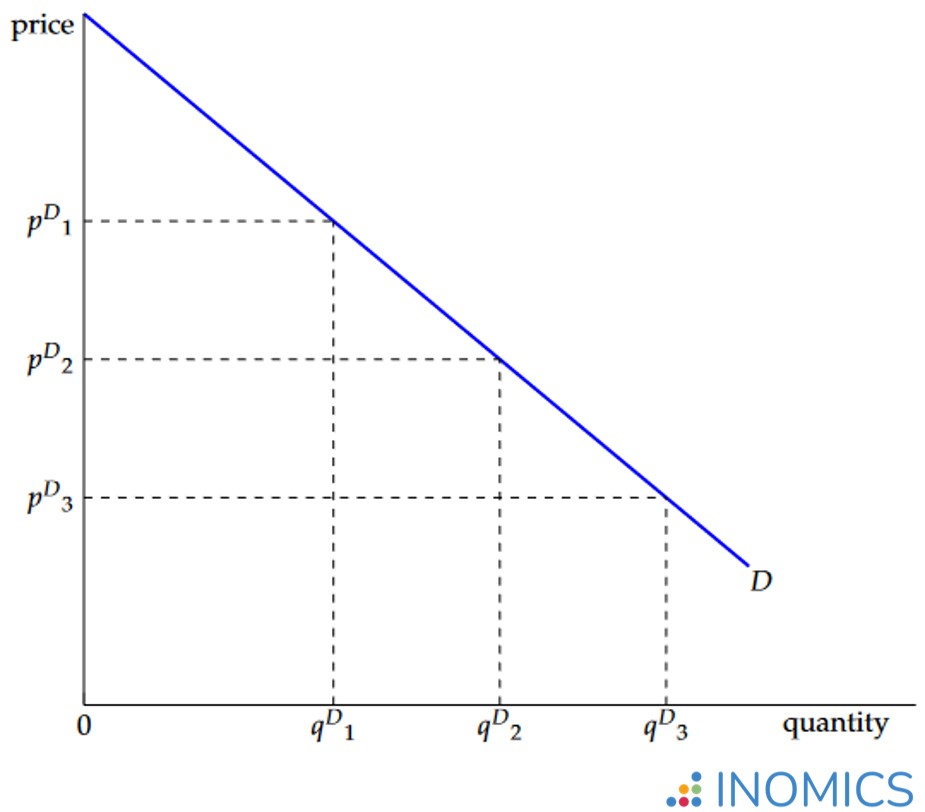
Figure 1: A linear demand curve
Note how the demand curve shown might be representing the preferences of a single individual for the item: the individual decides to buy more (less) of the item as its price falls (rises). This movement along the demand curve shows the inverse relationship between price and quantity demanded, which is known as the law of demand.
Alternatively, it represents the quantities of the item demanded by all participants in the market at various prices, i.e. the market demand curve. The market demand curve is simply the sum of all individual demand curves for the item in the economy. In general, firms will be interested in estimating market demand rather than individual demand for their products and services.
A demand curve need not be linear (hence the name “curve”!) and its slope at each point represents (but is not the same as) the price elasticity of demand. This shows how sensitive the individual is or consumers in the market are to changes in price.
Demand curves are drawn at a given level of income for the individual or consumers in the market. Should the income level change, the demand curve will shift inwards (shift to the left) or outwards (shift to the right), depending on whether income has risen or fallen and the item’s income elasticity of demand. For “normal” consumer goods and services, greater quantities will be demanded at every price if income rises and the demand curve shifts outwards to the right.
For so-called “inferior” consumer goods and services, lower quantities will be demanded at each price if income rises. The demand curve will shift inwards to the left, as consumption of such goods and services is replaced by consumption of other goods and services that have become affordable due to the rise in income.
A special case arises when people buy goods and services in order to display their income or wealth to others, so-called “conspicuous consumption”. In this case the demand curve can be upward-sloping because the item’s value to the individual rises as price increases. This is because the show-off, social-status power of the item rises, the higher its price. Such items are typically branded as “luxury” and are known by economists as “Veblen” goods or services due to the economist and sociologist Thorstein Veblen who first studied them.
In practice, demand curves can be estimated by experimentation with price changes, observing consumer behavior for similar products or by surveying consumers about hypothetical changes in prices. Economists will generally choose to observe actual behavior rather than rely on hypothetical claims, i.e. revealed preferences are more meaningful than stated preferences. Market research is a huge industry but it essentially boils down to understanding the relationship between price and quantity and calculating demand curves.
Further reading
Most introductory economics text books cover the theories of demand and supply extensively. Often, the supply curve is discussed alongside the demand curve, and together these determine equilibrium price and quantity in a market.
For a more in-depth understanding of the demand curve, a neat critique of Alfred Marshall’s original theory of demand is presented by the free-market economist and 1976 Nobel prize winner Milton Friedman in “The Marshallian Demand Curve” (Journal of Political Economy, 1949).
Good to know
Many firms today conduct real-time analysis of customer demand and engage in “dynamic pricing”. Understanding how willingness-to-pay changes at different times of the day, week or year and differentiating prices accordingly allows producers to capture some of the consumer surplus for themselves. The markets for electricity and air travel are examples where dynamic pricing has become standard practice. As a consumer it is, therefore, often worth observing how prices change over time before making important purchases.
-
- Postdoc Job
- Posted 2 weeks ago
Postdoc (m/f/x)
in Trier, Germania
-
- Assistant Professor / Lecturer Job, Postdoc Job
- Posted 4 weeks ago
Assistant professorship(s) in the fields of accounting and finance at Department of Business Development and Technology
At Aarhus University in Herning, Danimarca
-
- Assistant Professor / Lecturer Job
- Posted 2 weeks ago
Assistant Professor - Economics
At Salisbury University in Salisbury, Stati Uniti
Currently trending in Stati Uniti

Related Items


Featured Announcements


Prossime Scadenze
- Lug 26, 2026
- Lug 26, 2026
- Lug 29, 2026
- Lug 31, 2026
- Lug 31, 2026


