Economics Terms A-Z
Income Elasticity of Demand
Read a summary or generate practice questions using the INOMICS AI tool
The income elasticity of demand formula YEDA is a measure of how the quantity demanded of an item A qA in a market is affected by a change in income Y on the demand side of the market:
\begin{equation}
\mathit{YED}_{A} = \frac{\Delta\mathit{q}_{A}}{\Delta\mathit{Y}} = \frac{\frac{\partial{q}_{A}}{\mathit{q}_{A}}}{\frac{\partial{Y}}{Y}}
\end{equation}
In the market for any good or service, how much of it is demanded depends to a large extent on its affordability to buyers. An item’s affordability is determined both by the price at which it is offered and by the buyers’ available budgets. While price elasticity of demand gauges the sensitivity of buyers to changes in the item’s price (it measures pricing sensitivity), income elasticity of demand considers the relationship between budgets and quantity demanded.
The concept of income elasticity is used to classify goods and services into two main types: normal and inferior. A normal good or service is one whose demand moves in the same direction as income. That is, if the buyer’s income increases (falls) then the buyer will demand more (less) of the product. In this case, YEDA > 0. On the other hand, an inferior good or service is one whose demand moves in the opposite direction to income, YEDA < 0.
Examples of normal items include consumer goods and services such as clothes, electronic goods, general transport services and theatre and concert tickets. Consumers generally want more as they become better off.
Normal goods and services can be subdivided further into the categories of basic necessities and luxury items. Basic necessities are items whose income elasticity of demand is inelastic, 0 < YEDA < 1. That is, demand does respond positively but it does not rise or fall by as much as income in response to any change in income.
As its name suggests, demand for a basic necessity is less sensitive to a change in income: the buyer needs it! In contrast, a luxury item is one whose demand increases as soon as it becomes affordable; its income elasticity of demand is said to be elastic, YEDA > 1.
Inferior goods and services include food staples such as bread and shared transport such as public bus services. When income rises and thus demand falls for an inferior good or service, its consumption is typically replaced by an alternative item with a higher income elasticity of demand. For example, consumers may switch their income away from bread in order to consume more meat, or they may purchase a private car or other, more comfortable form of transport to substitute for their public-bus journeys.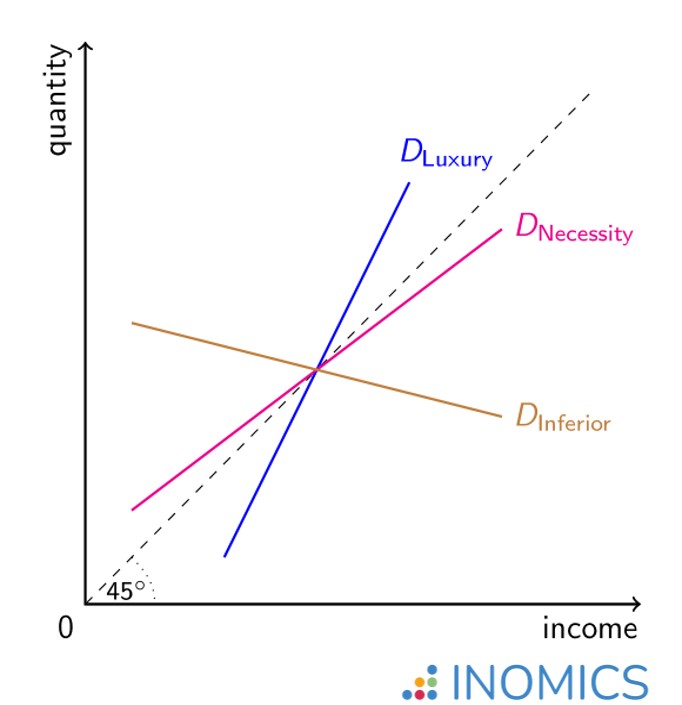
Figure 1: Various income elasticity of demand depictions
Income elasticity of demand is often described graphically using an Engel curve (named after the German statistician Ernst Engel). This is a plot of quantity demanded graphed against income (not to be confused with a demand curve, which shows the relationship between prices and quantity demanded!).
In the graph, the 45° dashed line through the origin represents proportionate responses of buyers to changes in income, i.e. unit income elasticity of demand, YEDA = 1. Along this line, if buyers’ income increases by 10% then their demand for the item also rises by 10%. The special cases of normal goods, necessity and luxury, are easily discernible in relation to this dashed line; inferior goods are recognisable by the negative relationship between income and quantity demanded.
Further reading
Aitchison and Brown provide further forms of Engel curves in their article, “A Synthesis of Engel Curve Theory” (The Review of Economic Studies, 1954) and point out that what constitutes a necessity for one income group in the economy may in fact represent a luxury for another income group. Hence their thesis is that Engel curves should be curves rather than straight lines!
Good to know
Economists are often criticized for assuming that more is always better. This may be an unfair claim. Economists tend to focus on the maximization of individual utility (read: happiness!), which need not always rise with income and consumption.
At some point, consumption is saturated. This is manifested through the large gifts and donations that the rich often make to others in the form of charity. Income elasticity of demand is also very relevant in Development Economics; income elasticity tends to be higher at lower levels of economic development.
-
- Assistant Professor / Lecturer Job, Professor Job
- Posted 2 weeks ago
Professor or Associate Professor or Associate Professor (Lecturer) Tenure-track position
At The University of Osaka in Osaka, Japan
-
- Assistant Professor / Lecturer Job
- Posted 1 week ago
Assistant Professor of Economics
At Marist University in Poughkeepsie, USA
-
- PhD Candidate Job
- Posted 17 hours ago
PhD Position in Macroeconomics
At Institute of Economics, University of Hohenheim in Stuttgart, Deutschland
Currently trending in USA
Related Items
-

Master Course in Economics at the Department of Economics - Roma Tre University
-

Master in International and Monetary Economics (MIME) - Joint Program by the Universities of Basel and Bern
-
PhD in Economics - University of Pavia & University of Milan - Admission to the 2026/2027 Academic Year (Cycle 42)


Bevorstehende Deadlines
- Jul 31, 2026
- Jul 31, 2026
- Aug 01, 2026
- Aug 01, 2026
- Aug 05, 2026


