Economics Terms A-Z
Production Possibilities Frontier (PPF)
Read a summary or generate practice questions using the INOMICS AI tool
The Production Possibilities Frontier (PPF) is a graph that can be used to describe the production of an economy in macroeconomics, or production decisions by a household or firm in microeconomics. It shows possible combinations of two (or more) products that an economy can make, in one simple graph – hence the name.
The PPF is often defined for two different goods that utilize the same inputs in their production; this can be shown on the vertical and horizontal axes of a graph. Moving further along one axis means the economy produces more of that good. To create the PPF, you need to know the opportunity cost of producing each good. In other words, you must know how many units of good A you must give up in order to produce one more unit of good B at all levels of total production.
To demonstrate with a simple example, let’s consider an economy that produces food and electronics. Let’s further assume that the only production inputs in this economy are the labor hours required to produce the goods.
The economy’s production can be represented in the following table:
| Food | Electronics | |
| Units produced per labor hour | 10 | 5 |
If the economy has a total endowment of 100 labor hours, then it can produce 1000 units of food or 500 units of electronics by spending all 100 hours on either good. These two points become the intercepts on the PPF graph. If we graph food on the horizontal axis and electronics on the vertical axis, then the x-intercept will be 1000 and the y-intercept will be 500.
Now, let’s assume that the amount of labor hours required to produce these goods is constant at all levels of production. That is, regardless of whether we make 1 unit of food or 1000 units of food, it always takes one labor hour to make 10 units of food. Likewise for electronics. Taken together, these facts will produce the following PPF:
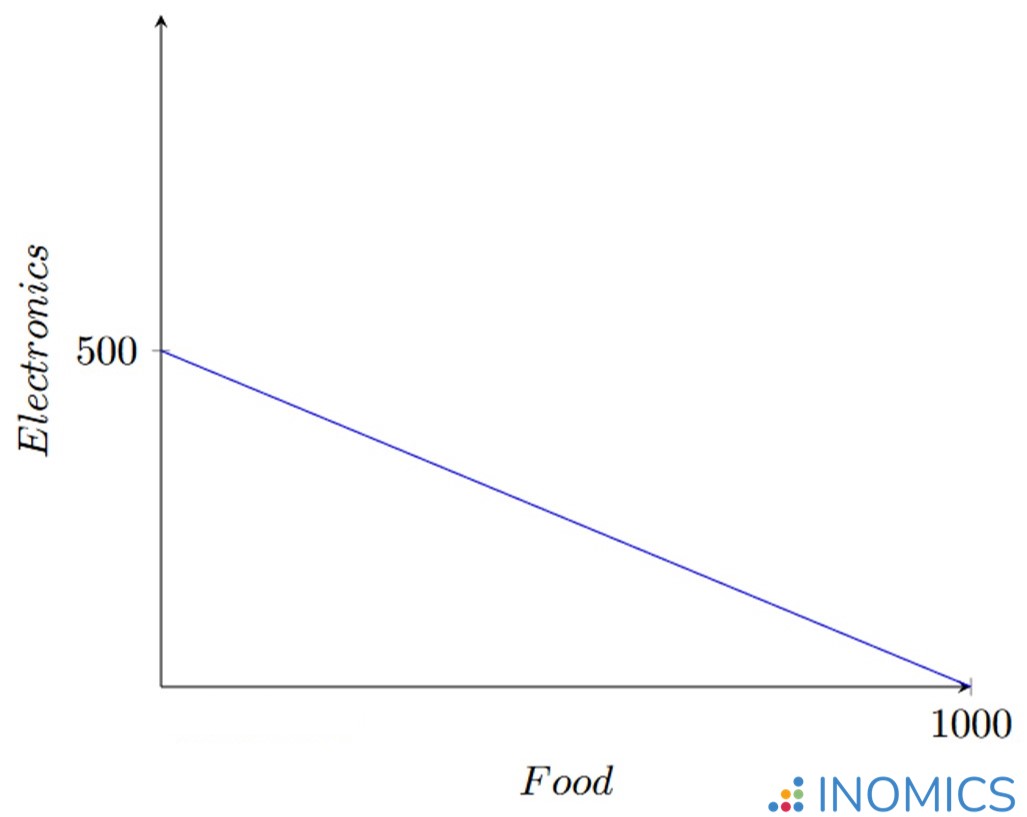
Figure 1: A simple economy's PPF
One useful aspect of the PPF is that it helps us easily see if an economy has reached a Pareto efficient outcome. At every point on the line shown, the economy is using all of its available labor hours to produce some mix of the two goods. This is efficient in an economic productivity sense.
But, every non-negative point under the line is also a possible product mix. The problem with them is that they are inefficient. This is because the economy must leave some of its available resources unused to reach a point under the line. In this case, a Pareto improvement can be made by shifting the production mix to any point on the line, where all available inputs are being used.
This can be easily seen by starting at any point under the line and moving vertically until the line is reached. In this case, the same amount of food (on the horizontal axis) is produced, but more electronics are produced (vertical axis). We produced more electronics without sacrificing any food, so the economy is strictly better off – a Pareto improvement has been made.
What does the slope of the PPF mean? Remember that the slope of a line is a ratio that shows the rate of change of the y variable compared to the x variable. Also remember that we assumed the amount of labor hours used to produce each good is constant at all levels of production – in other words, the tradeoff between the two goods is always the same. This means that the slope of the PPF at any point is the opportunity cost between the two goods!
What happens if production in this economy is affected by the law of diminishing returns (a more common scenario)? That is, the more a good is produced, the more labor hours it takes to produce each next unit. This would be the case if the production function was something like a Cobb-Douglas function.
In this case, the graph will be curved, as shown below:
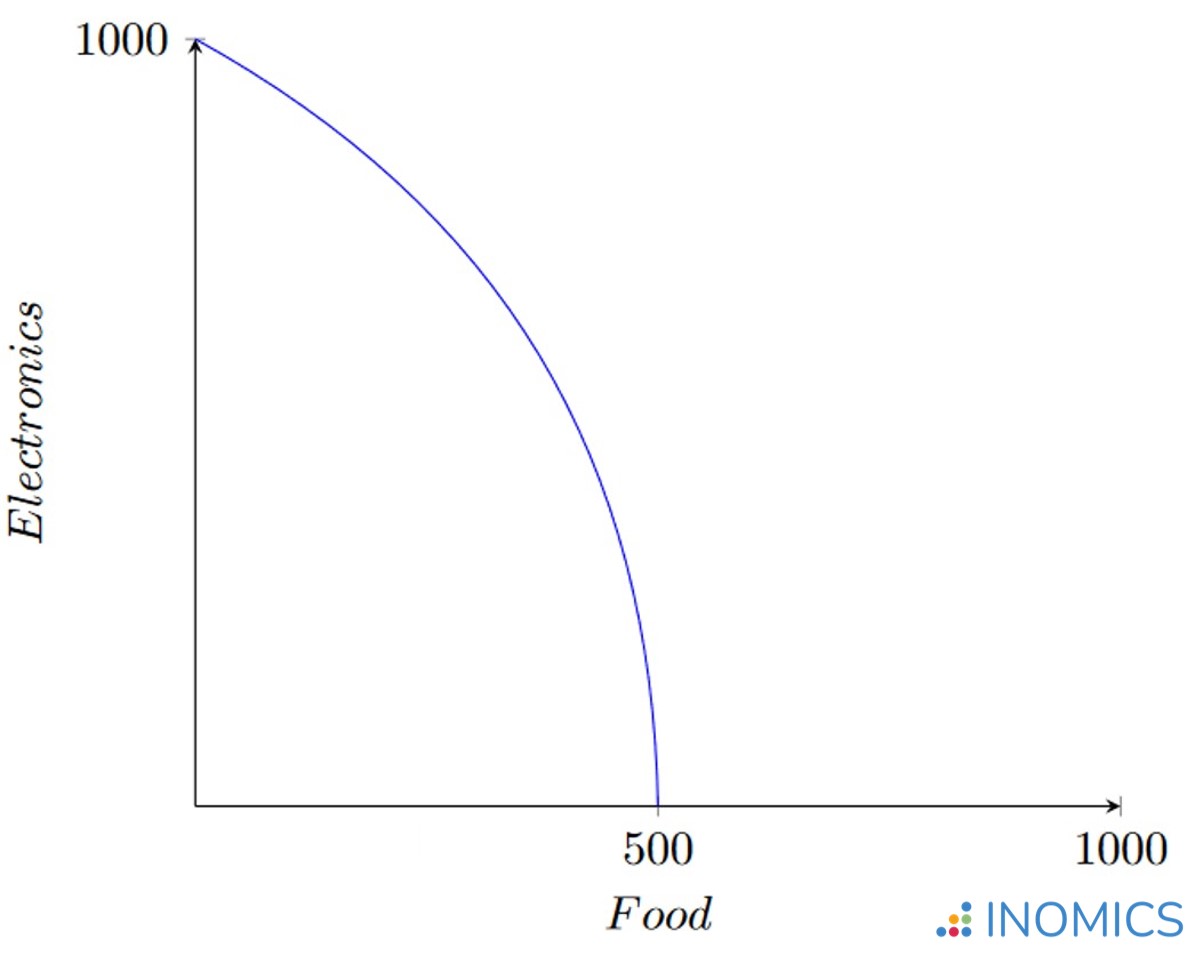
Figure 2: A simple economy's PPF with diminishing marginal returns
Now, the opportunity cost of producing either good changes as you move along the graph. Close to the y-intercept, where we are producing mostly electronics, it costs more and more labor hours to produce the next unit of electronics. Consequently, we are giving up more and more units of food to produce each next unit of electronics. If we start to move down the curve, we start producing more food and less electronics.
We can still find the opportunity cost at any of these points by taking the derivative of the function to get the slope. In this case, the opportunity cost for producing more food is higher the closer we get to the x-axis, and vice versa.
As a note, economies of scale can be represented in the PPF, too. Economies of scale mean that the opportunity cost for producing a good fall as more of that good is produced. In this case, the graph is likely to have a bowed-inwards (convex) shape. Keeping to our example of food and electronics, in this case moving further along the x-axis would produce increasing amounts of food and fewer amounts of electronics as before. But, the opportunity cost of producing one more unit of food in terms of electronics would decrease as more food is produced.
Good to Know
The PPF clearly defines the full product mix that a given economy can produce. We have already seen that every point on the line is Pareto efficient. But, for economies that trade with other economies, it is actually possible for a country to consume at a point above its PPF.
From the model we’ve studied above (a theoretical economy producing two products in autarky), this is not possible. Every point above the PPF represents an amount of production that the country cannot reach, because it requires more input (in this case labor hours) than is available. For example, if we return to our linear PPF example above, it would be impossible for the country to produce more than 1000 units of food. It can produce 10 units of food in one labor hour, and it has 100 labor hours available, for a maximum production of 1000 units of food.
When it comes to consumption, a trading economy is not restricted in the same way, due to the gains from trade that comparative advantage allows. When nations specialize in producing goods that they are relatively more efficient at producing, total output in the world economy can actually be higher than if every country produces only for itself. To see how this works, head over to our article about comparative advantage.
-
- Executive / Senior Industry Job
- Posted 1 week ago
Volkswirt/in (m/w/d)
At RWI – Leibniz-Institut für Wirtschaftsforschung in Essen, Germany
-
- Workshop
- Posted 1 week ago
6th Workshop on Financial Econometrics and Empirical Modeling of Financial Markets
Between 22 Oct and 23 Oct in Berlin, Germany
-
- Conference
- Posted 22 hours ago
48th RSEP International Conference on Economics, Finance and Business
Between 1 Oct and 2 Oct in Rome, Italy
Currently trending in United States


Related Items


Upcoming Deadlines
- Aug 05, 2026
- Aug 07, 2026
- Aug 07, 2026
- Aug 10, 2026
- Aug 14, 2026


