Economics Terms A-Z
Consumer Price Index
Read a summary or generate practice questions using the INOMICS AI tool
The Consumer Price Index, or CPI, describes developments in the average cost of living in a country. The percentage change in the consumer price index over a given period is the most widely used measure of inflation.
To create the CPI, national statistical agencies usually use information from household surveys to construct a market basket of goods and services that are commonly consumed in the country. They then track the cost of purchasing this basket over time. The basket includes items of daily life like milk, fruit, cereal, and coffee, as well as expenses for housing, transport, clothing, health, education, and recreational activities.
Calculating the CPI
The CPI is calculated as the cost of this basket at a given point in time, Ct, relative to its cost in the base year, C0:
\begin{equation*}
\mathit{CPI}_t= \frac{\mathit{C}_t}{\mathit{C}_{0}}*100
\end{equation*}
As an example, imagine an economy with two goods, A and B, that are consumed at two points in time, t = 0 and t = 1. The realized prices (P) and quantities (Q) are as follows:
| t = 0 (base) | t = 1 | |||
| Q | P | Q | P | |
| Good A | 10 | €50 | 8 | €55 |
| Good B | 80 | €20 | 83 | €22 |
How can we calculate the CPI for this economy?
Let’s assume that the consumed quantities of goods A and B in t = 1 had remained at the same levels as in t = 0. We can then calculate the cost of the consumption basket as:
\begin{equation*}
\mathit{C}_0= \sum(\text{Q}_0*\text{P}_0) = (10 * €50) + (80 * €20) = €2,100
\end{equation*}
\begin{equation*}
\mathit{C}_1= \sum(\text{Q}_0*\text{P}_1) = (10 * €55) + (80 * €22) = €2,310
\end{equation*}
The CPI would then be calculated as:
\begin{equation*}
\mathit{CPI}_0= \frac{\mathit{C}_0}{\mathit{C}_{0}} * 100 = 100 \text{ (base period)}
\end{equation*}
\begin{equation*}
\mathit{CPI}_1= \frac{\mathit{C}_1}{\mathit{C}_{0}} * 100 = \frac{€2,310}{€2,100} * 100 = 110
\end{equation*}
Keeping the items and their quantities in the consumption basket constant over time may seem odd, but this ensures comparability and allows us to isolate the price effect on what is purchased. In reality, consumers will react to these price changes depending on the elasticity and inelasticity of demand.
Therefore, to account for changes in consumer habits and reflect changes in the actual cost of living, it is important to update the CPI basket periodically (ideally at least every five years). Updating the basket is costly, as it requires the collection of information from large household surveys, which is why this is usually only done in intervals of several years.
For example, compared to the 1990s, in the 2020s CDs/DVDs and their players are no longer widely purchased and shouldn’t be included in the bundle anymore. Meanwhile, internet services and smartphones should enter the consumption basket as they are very commonly purchased nowadays.
In the example above, we observe that the consumed quantity of good A decreased in face of the price increase, while the consumed quantity of good B increased in spite of the rise in prices. If we had calculated the value of the consumption basket at current quantities, this would be:
\begin{equation*}
\mathit{C}_1= \sum(\text{Q}_1*\text{P}_1) = (8 * €55) + (83 * €22) = €2,266 \text{ and}
\end{equation*}
\begin{equation*}
\mathit{CPI}_1= \frac{\text{C}_1}{\text{C}_0} * 100 = \frac{€2,266}{€2,100} * 100 = 107.9
\end{equation*}
In our example, accounting for changes in consumption patterns thus renders a smaller (and more accurate) rise in the cost of living than when the quantities are held constant.
Measuring inflation
The rate of inflation is easy to calculate once CPI is measured. It is the percentage change in the CPI between two points in time, where the CPI in the base year is indexed to 100. In our example, the CPI increased from 100 in the base year to 110 in the current year, which means that inflation is 10% over the period.
Another method to calculate inflation uses the GDP Deflator, though the CPI method is more common. The GDP Deflator’s advantage over the CPI is that it is not based on a fixed basket of goods and services, since GDP always reflects current production patterns. However, it also takes account of some prices that aren’t relevant to consumers - like military spending - so the CPI is still preferred in many cases.
Of course, every individual is likely to purchase a slightly unique basket of goods, which may differ a lot from the official average basket of goods used to calculate the CPI. Thus, when inflation is reported, while it normally represents a good indicator of the state of the economy at macroeconomic level, it may not be appropriate for everyone. Some people will have higher or lower personal inflation rates than others.
Good to know
Globally, consumer price indices fell between 1980s and 2000, particularly in high income countries, and remained relatively stable thereafter until the 2008 financial crisis. Since then, consumer prices have been more volatile, driven particularly by fluctuations in food and energy prices. Those categories have exhibited the highest rates of average inflation in recent decades, and make up an essential share of total consumer spending.
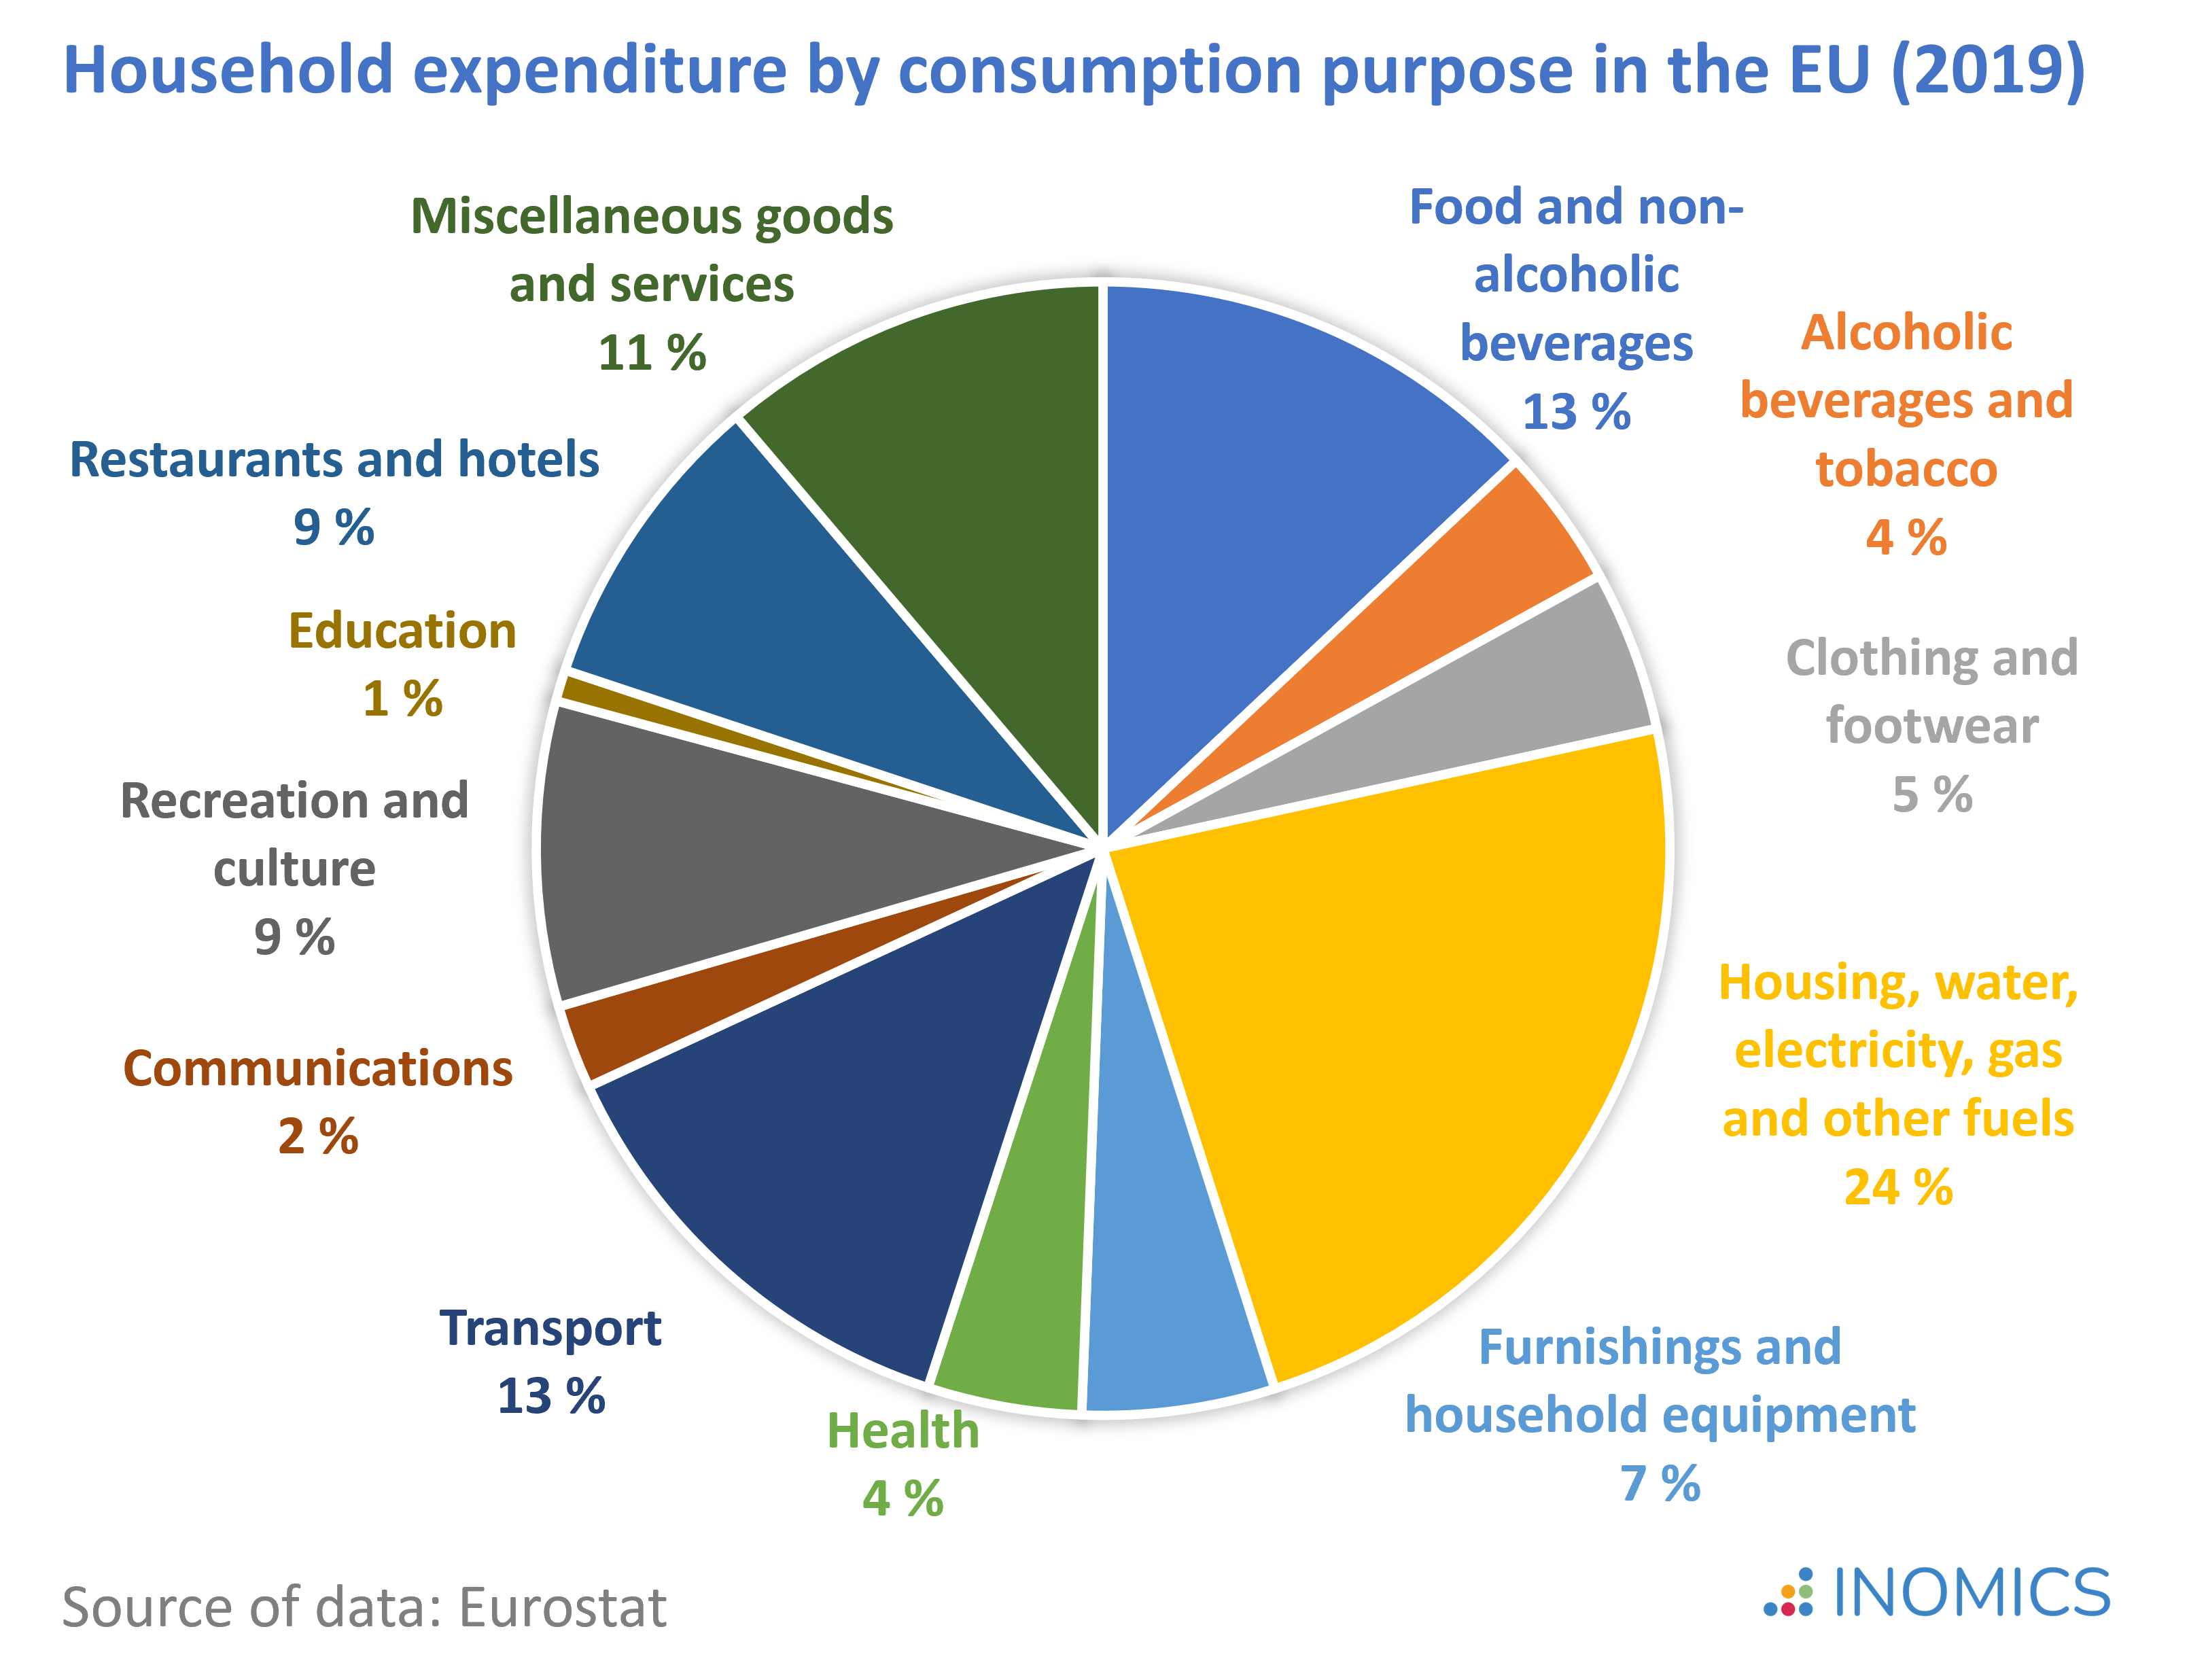
In 2019, housing - including water, electricity, gas and other fuels - was the largest contributor to total household expenditure in the European Union (EU), accounting for 24 percent of total consumption. The second largest positions were food and beverages and transport, each accounting for 13 percent of total consumption.
-
- Research Assistant / Technician Job
- Posted 2 weeks ago
Research Assistant: Foreign and Defense Policy; Demographics and Political Economy
At American Enterprise Institute in Washington, États-Unis
-
- Assistant Professor / Lecturer Job, Professor Job
- Posted 1 week ago
Professor or Associate Professor or Associate Professor (Lecturer) Tenure-track position
At The University of Osaka in Osaka, Japon
-
- Event, Conference, PhD Candidate Job
- Posted 1 week ago
Tor Vergata Ph.D. Conference in Economics
At University of Rome Tor Vergata in Rome, Italie
Currently trending in États-Unis

Related Items
-

HEMAP – Two-year Master programme in Health Economics, Management and Policy
-

LM(EC)2 – Two year Master's programme in Economics and Econometrics – Alma Mater Studiorum - Università di Bologna
-

TEaM – Two year Master's programme in Tourism Economics and Management, Alma Mater Studiorum - Università di Bologna
Featured Announcements


Échéances à venir
- juil 29, 2026
- juil 31, 2026
- juil 31, 2026
- Août 01, 2026
- Août 01, 2026


