Economics Terms A-Z
GDP Deflator
Read a summary or generate practice questions using the INOMICS AI tool
The gross domestic product price deflator, or GDP deflator, is a price index that shows how, on average, prices for all goods and services produced in an economy change over time. It is commonly used to estimate the rate of inflation.
The GDP gives the market value of all final goods and services currently produced within a country during a given time period. The items and quantities that enter into its calculation vary year by year, so it is a very current way to estimate inflation.
Calculating the GDP Deflator
The GDP deflator, Rt, is calculated as the ratio between the nominal and the real GDP, where the real GDP is measured in prices of a defined base year, t = 0:
\begin{equation*}
\mathit{R}_t= \frac{\text{GDP}_t}{\text{realGDP}_{t}}*100 = \frac{\sum(\text{Q}_t*\text{P}_t)}{\sum(\text{Q}_{t}*\text{P}_0)}*100
\end{equation*}
As an example, imagine an economy that produces two final goods, A and B, that are consumed at two points in time, t = 0 and t = 1. The realized prices (P) and quantities (Q) are as follows:
| t = 0 (base year, 2018) | t = 0 | t = 1 (2019) | t = 1 | |
| Q | P | Q | P | |
| Good A | 10 | €80 | 15 | €80 |
| Good B | 40 | €20 | 40 | €22 |
The nominal GDP in period t = 1 is the market value of all final goods produced in the economy in current prices:
\begin{equation*}
\text{GDP}_1= \sum(\text{Q}_1*\text{P}_1) = 15 * €80 + 40 * €22 = €2,080
\end{equation*}
The real GDP in period t = 1 is the value of the production at constant prices of the base year, t = 0:
\begin{equation*}
\text{realGDP}_1= \sum(\text{Q}_1*\text{P}_0) = 15 * €80 + 40 * €20 = €2,000
\end{equation*}
The GDP deflator is the ratio between the nominal and real GDP in t =1:
\begin{equation*}
\mathit{R}_1= \frac{\text{GDP}_1}{\text{realGDP}_1}*100 = \frac{€2,080}{€2,000} * 100 = 104
\end{equation*}
The base year of the deflator is indexed at 100 and, in the example, the current value of the deflator is 104, so inflation is 4% between t = 0 and t = 1. This is easy to see in this simple example. The general formula for calculating the GDP Deflator inflation rate is as follows:
\begin{equation*}
\text{Inflation rate} = \frac{(\text{GDP Deflator}_{t =1}-\text{GDP Deflator}_{t =0})}{\text{GDP Deflator}_{t =0}} * 100 = \frac{(€2,080 - €2,000)}{€2,000} * 100 = 4\%.
\end{equation*}
Alternate method to measure inflation
An alternative measure of inflation uses the consumer price index (CPI). Since the GDP Deflator reflects price changes in the prices of all domestically produced goods and services, it is a much broader price index than the CPI. While the CPI focuses on price changes in goods and services commonly purchased by consumers, the GDP deflator measures price changes purchased by consumers, businesses, and the government, and those sold for export.
Thus, the key advantage the GDP Deflator has over the CPI is that the components of GDP are more current than the mostly fixed CPI basket of goods. However, it also includes non-consumer items (such as military spending), which is why the CPI basket is the preferred indicator for changes in the cost of living in a country.
Good to know
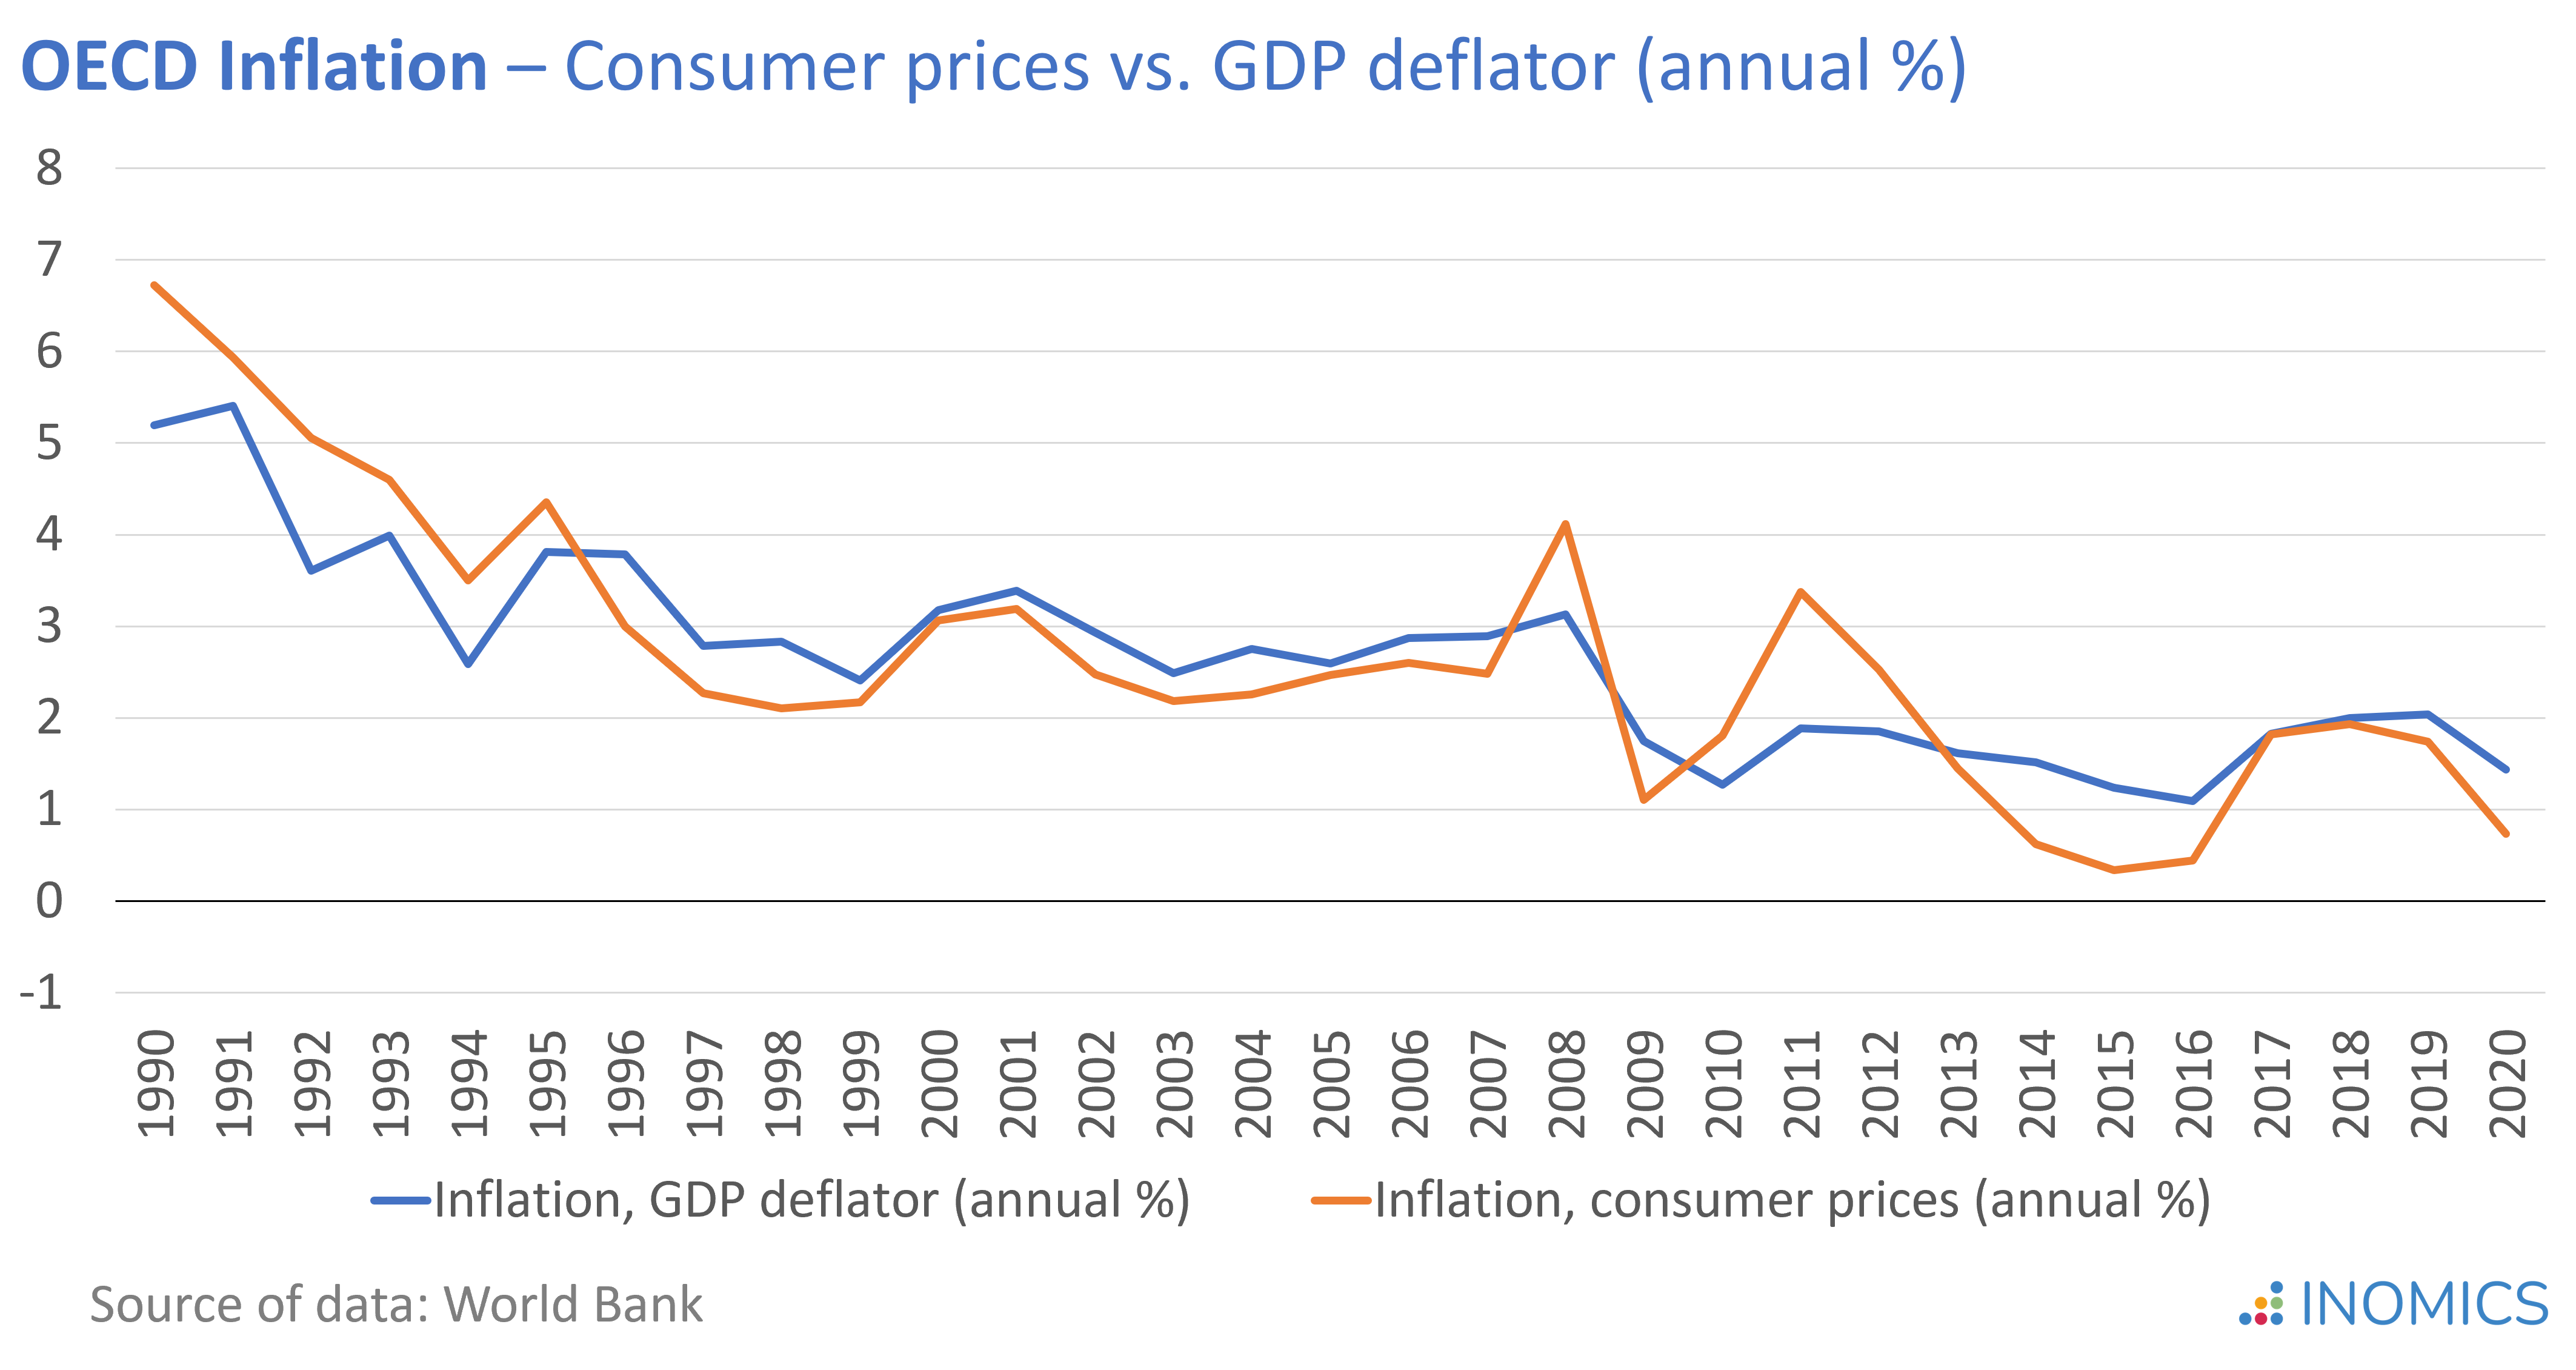
The two different measures of inflation (CPI and GDP deflator) have a slightly different economic interpretation and their relevance can change over time. The figure below shows the annualized inflation rate in the OECD area over the past two decades as measured by consumer prices and the GDP deflator. While both measures follow largely similar trends, there are important differences.
When the 2008 financial crisis hit, average consumer prices rose by about 4 percent. After the stock market crashed and economic growth plummeted, the decline in economic activity was accompanied by a sharp decline in prices, followed by another increase up to 2011, attributable to surging energy and food prices. While the GDP deflator follows the same pattern, consumer prices have been remarkably more volatile.
This deviation is also apparent in a general price decline attributable to the COVID-19 pandemic. The pandemic has had a strong impact on consumers, with demand almost disappearing for some goods and services and being temporarily in excess for others. The overall result of these opposing effects, in conjunction with volatile oil prices and increased government spending, was a stronger fall in consumer prices than in GDP.
Test whether you understood the concept of the GDP Deflator...
-
- Research Assistant / Technician Job
- Posted 2 weeks ago
Research Assistant: Foreign and Defense Policy; Demographics and Political Economy
At American Enterprise Institute in Washington, United States
-
- Assistant Professor / Lecturer Job
- Posted 1 week ago
Assistant (F/M) in the Research and Teaching Employment Group at Krakow University of Economics
At Krakow University of Economics in 3094802, Poland
-
- Conference
- Posted 1 week ago
MIRDEC 27th Barcelona 2026 Conference
Between 24 Nov and 25 Nov in Barcelona, Spain
Currently trending in United States


Related Items


Upcoming Deadlines
- Jul 29, 2026
- Jul 31, 2026
- Jul 31, 2026
- Aug 01, 2026
- Aug 01, 2026


