Economics Terms A-Z
GDP
Read a summary or generate practice questions using the INOMICS AI tool
What is the size of a nation’s overall economy? Is it growing or shrinking? And what sectors are driving these changes? Gross Domestic Product (GDP) is the most commonly used measure of economic activity that provides answers to these questions. It gives the market value of all final goods and services currently produced within a country’s borders during a given time period.
Breaking down this definition yields four key aspects to understanding how GDP is defined and measured:
- Market value: Goods are valued at their market prices. Non‐market activities like leisure, unpaid work (e.g. housework, childcare, etc.), and black market or illegal activities do not contribute to GDP.
- Final goods and services: GDP is the aggregate value of final goods and services intended for the end user. Intermediate goods and services used by other firms as inputs in production (i.e, fabric used to make a sweater) do not contribute to GDP.
- Currently produced in a given period: GDP only includes goods and services produced during the indicated time period, normally a year. Sales of goods that had been produced in the past do not contribute to GDP. Some countries also calculate quarterly GDP data.
- Within a country: GDP measures the value of goods and services produced within a country’s borders, whether by its own citizens or by foreigners located there.
Calculating GDP
GDP can be calculated using three alternative methods: the production, income, or expenditure approach. All three approaches should give the same result when calculated correctly.
The circular flow diagram displayed below provides a simple model to illustrate the relationship between the three approaches. In this diagram, households own the factors of production that are supplied to firms in the production process, and earn the returns on these (factor markets). Firms use the production factors to produce goods and services, which households purchase for consumption (product market). In equilibrium, it holds that: production = income = expenditure.
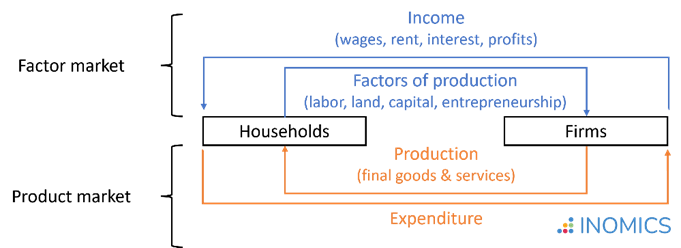
Figure 1: Circular flow diagram for calculating GDP
As an example, imagine an economy with two companies that produce two goods: steel and cars. Steel is used as an intermediate good in the production of cars. In a given year, economic activity in the economy has been as follows:
| Steel Company | Car Company | ||
|---|---|---|---|
| Revenue from sales | €100 | Revenue from sales | €250 |
| -Expenses (wages) | €80 | -Expenses (wages) | €70 |
| -Expenses (steel) | €100 | ||
| Profit | €20 | Profit | €80 |
What would be the GDP of this economy?
1. Production approach: The production approach aggregates the market value of all final goods and services. It is the sum of the “value added” (total sales minus the value of intermediate inputs) at each stage of production. Measuring value added at each stage of production avoids “double-counting” the contribution of intermediate goods.
- Following the production approach, GDP in our example economy is calculated as the value of steel produced, plus the value of cars produced, minus the value of intermediate goods used in production, so GDP = €100 + (€250 - €100) = €250. Note that if we had calculated GDP as the total value of all steel and cars produced (€100 + €250 = €350), then the value of steel would have been counted twice, as it is embodied in the value of cars.
2. Income approach: The income approach calculates value added as the income earned by the factors of production in the economy. Three core components enter into the calculation. The first and main component is domestic income, which is defined as:
Domestic income = wages (income for labor)
+ rent (income for land)
+ interest (income for capital)
+ profits (income for firms)
The second component of the income approach adds government taxes minus subsidies, to account for their effect on factor returns. The third component is depreciation, which reflects the decrease in the value of capital that results from its use.
- In our example economy, there are two sources of income: wages and profits. The production of steel generated wage earnings of €80 and firm profits of €20. The further processing to the final cars provided additional wage earnings of €70 and generated profits of €80. We thus have GDP = wages + profits = (€80 + €70) + (€20 + €80) = €250, which matches the value calculated using the production approach.
- Now, let’s assume this economy has a tax that earns the government €10 from the businesses’ operations. Let’s also assume we had €10 worth of depreciation for each business in the period. Then, the final calculation would be GDP = wages + profits + tax income + depreciation = (€80 + €70) + (€0 + €60) + €20 (tax income from each business) + €20 (depreciation from each business) = €250.
3. Expenditure approach: The expenditure approach is the most commonly used method to calculate GDP. It calculates the total domestic expenditure using the following formula (the same as for aggregate demand):
GDP = C + I + G + (X – M) = C + I + G + NX,
where
C = Consumption (expenditure by households on consuming goods and services)
I = Investment (expenditure on capital goods and additions to inventories)
G = Government spending (government consumption expenditure and gross investment)
NX = Net exports (value of exports, X, minus value of imports, M)
The extended five-sector circular flow diagram displayed below illustrates the logic underlying the calculation. In this diagram, households do not spend all income on consumption expenditures, but also save money, pay government taxes, and purchase goods or services from abroad. Savings are reinjected into the economy as investment, taxes finance government spending, and products or services not sold domestically are being exported.
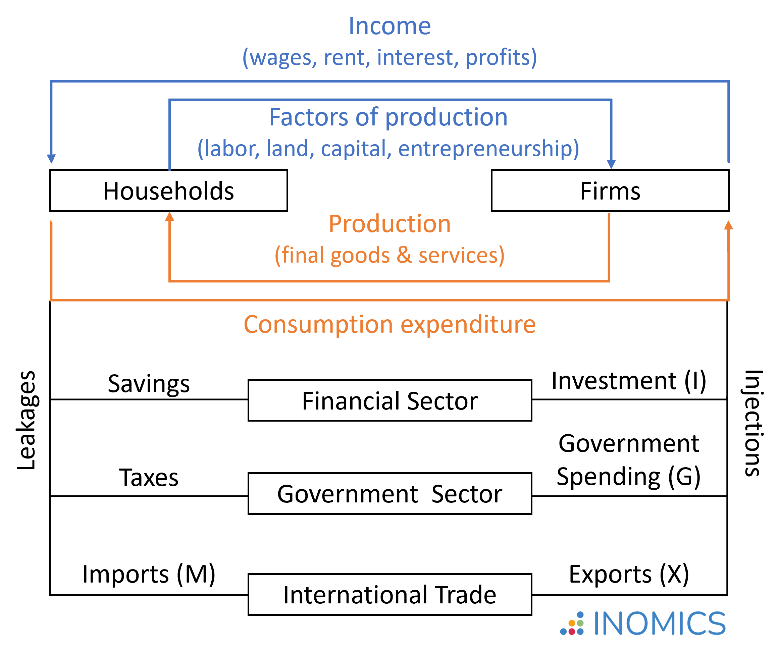
Figure 2: Illustrating the expenditure approach for calculating GDP
GDP vs. GNP
As the term “Domestic” (in Gross Domestic Product) indicates, the inclusion criterion for the calculation of GDP is defined in geographic terms: It is the market value of all final goods and services produced within a country’s borders, regardless of the nationality of the producer.
In contrast, the Gross “National” Product, GNP, defines the inclusion criterion based on nationality: It is the market value of all final goods and services produced by nationals of the country, regardless of whether the production occurred within or outside of the country’s borders.
The relationship between GDP and GNP is thus defined as:
GNP = GDP
+ income earned by citizens from working or investing overseas
− income earned by foreign nationals in the domestic economy
Nominal vs. real GDP and GDP growth rate
Nominal GDP measures the value of production in current prices; that is, the prices that were realized in the economy during the period in which the output was produced. If prices increased from one period to the next while output remained unchanged, the nominal GDP would rise even though production remained constant.
To improve comparability and provide a better basis for evaluating the performance of an economy over time, economists prefer calculating the ‘real’ value of GDP. Real GDP adjusts the value of output for inflation or deflation according to a defined base year, such that changes over time can be fully attributed to shifts in the quantity of production. If prices change from one period to the next but actual output does not, real GDP remains the same.
The GDP growth rate is calculated as the percentage change in real GDP from one period to the next. Positive values indicate economic growth, while negative values indicate a contraction.
As an example, imagine an economy that produces two final goods (A and B) at two points in time. The realized prices (P) and quantities (Q) are as follows:
| 2018 | 2019 | |||
|---|---|---|---|---|
| P | Q | P | Q | |
| Good A | €80 | 10 | €80 | 15 |
| Good B | €20 | 40 | €22 | 40 |
Nominal GDP: Using the production approach, we can calculate the nominal GDP for each period t, GDPt, as the market value of all N final goods produced in the economy. This is:
GDPt = P1tQ1t + P2tQ2t + … + PNtQNt.
In our example, this would be:
- GDP2018 = €80 * 10 + €20 * 40 = €1,600, and
- GDP2019 = €80 * 15 + €22 * 40 = €2,080.
Real GDP: However, a direct comparison of the two values may be misleading. From 2018 to 2019, we observe both an increase in the quantity of production of Good A, and an increase in the price for Good B. To assess how economic performance has changed, we may want to adjust for the price change by calculating the real GDP in period t, GDPt. It is derived as the value of the production in t at constant prices of the base year, t0. This is:
realGDPt = P1t0Q1t + P2t0Q2t + … + PNt0QNt.
In our example, this would be:
- realGDP2018 = €80 * 10 + €20 * 40 = €1,600 and
- realGDP2019 = €80 * 15 + €20 * 40 = €2,000.
GDP Deflator: The ratio between nominal GDP and real GDP gives the GDP deflator. The GDP deflator shows how, on average, prices for all goods and services produced in an economy change over time and can be used as a measure of inflation. A full discussion of the GDP deflator is included in that article.
Growth rate: Based on the real GDP value, we can then calculate the GDP growth rate between two points in time, t-1 and t, as:
\begin{equation*}
\text{growth}_t= \frac{(\text{realGDP}_t-\text{realGDP}_{t-1})}{\text{realGDP}_{t-1}}.
\end{equation*}
In our example, this would be:
\begin{equation*}
\text{growth}_{2019} = \frac{(\text{realGDP}_{2019}-\text{realGDP}_{2018})}{\text{realGDP}_{2018}} = \frac{(2,000 - 1,600)}{1,600} = 0.25 = 25\%.
\end{equation*}
GDP per capita
Beyond the absolute value of GDP measuring total economic activity, economists are also interested in the average value of production (or income) generated per person in a country. Therefore, GDP per capita is calculated by dividing a country’s GDP by the total population of that country.
Even though this is a rough approximation for the standard of living in that country—which is influenced by many other factors—it does give an indication of whether the country is materially better or worse off compared to others.
Good to know
Besides income, a society’s standard of living will be influenced by other factors that are not directly reflected in the calculation of GDP, such as levels of health, education, and environmental quality. Moreover, being calculated as an average value, GDP per capita does not account for the distribution of income in the country. To draw conclusions about the standard of living in a country and its development, it is useful to consider further metrics in addition to GDP, like the Gini index as a measure of inequality and the human development index (HDI).
Test whether you understood the concept of GDP...
-
- Postdoc Job
- Posted 2 weeks ago
Postdoc (m/f/x)
in Trier, Germania
-
- Assistant Professor / Lecturer Job, Professor Job
- Posted 1 week ago
Professor or Associate Professor or Associate Professor (Lecturer) Tenure-track position
At The University of Osaka in Osaka, Giappone
-
- Postdoc Job
- Posted 1 week ago
Postdoctoral Research Fellow or Social Science Research Scholar at Stanford (USA) or Heidelberg University (Germany)
At Stanford University in Stanford, Stati Uniti
Currently trending in Stati Uniti
Related Items
-

Master in International and Monetary Economics (MIME) - Joint Program by the Universities of Basel and Bern
-

Master Course in Economics at the Department of Economics - Roma Tre University
-

LM(EC)2 – Two year Master's programme in Economics and Econometrics – Alma Mater Studiorum - Università di Bologna
Featured Announcements


Prossime Scadenze
- Lug 26, 2026
- Lug 26, 2026
- Lug 29, 2026
- Lug 31, 2026
- Lug 31, 2026


