Economics Terms A-Z
Inflation
Read a summary or generate practice questions using the INOMICS AI tool
Inflation describes an increase in the general price level in an economy over a certain period, usually a year. It is typically calculated for a broad basket of goods and services, reflecting changes in the overall cost of living. However, it can also be more narrowly defined for a set of specific goods, for example to reflect only price changes in the costs for food, housing, energy, or transportation.
Drivers of inflation
Economists distinguish three central causes of inflation:
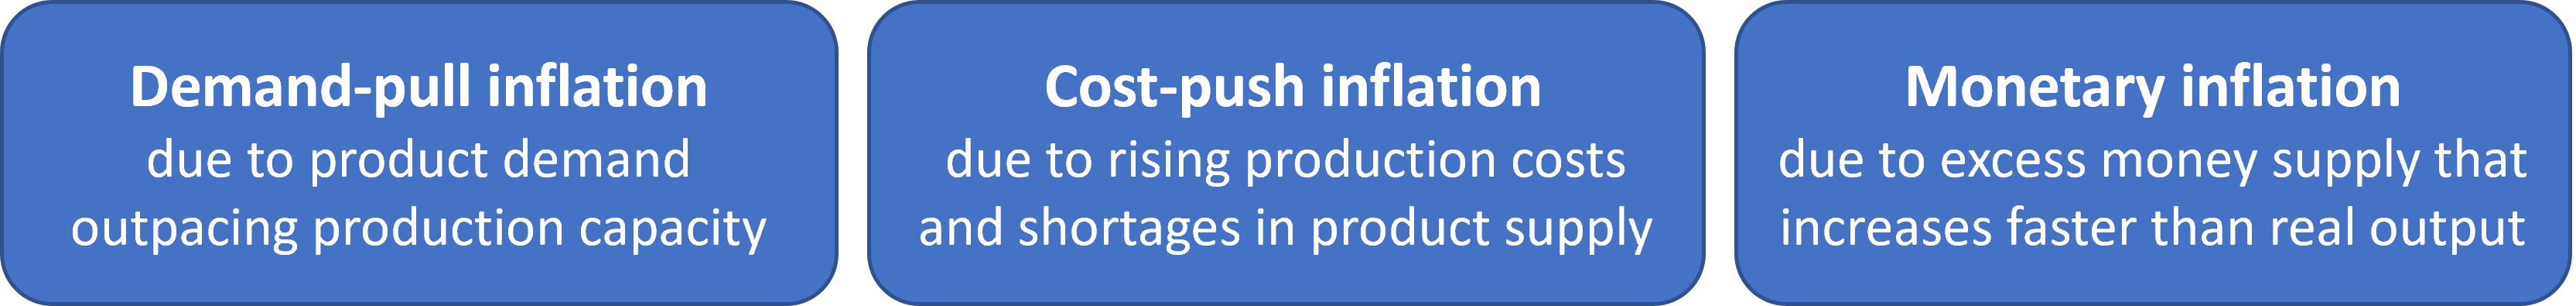
While the first and second describe imbalances on product markets, the third is the result of domestic monetary policy.
Demand-pull inflation
Demand-pull inflation occurs when consumer demand outpaces supply. That is, aggregate demand (AD) rises faster than production capacity and thus aggregate supply (AS). This type of inflation is typically associated with strong economic growth – or the anticipation thereof. When consumers are confident that the economy is performing well, they expect income and employment to rise, and increase spending (the AD curve shifts outwards, depicted below). Other causes of a rise in demand may include tax cuts, which increase consumers’ discretionary income, or higher government spending.
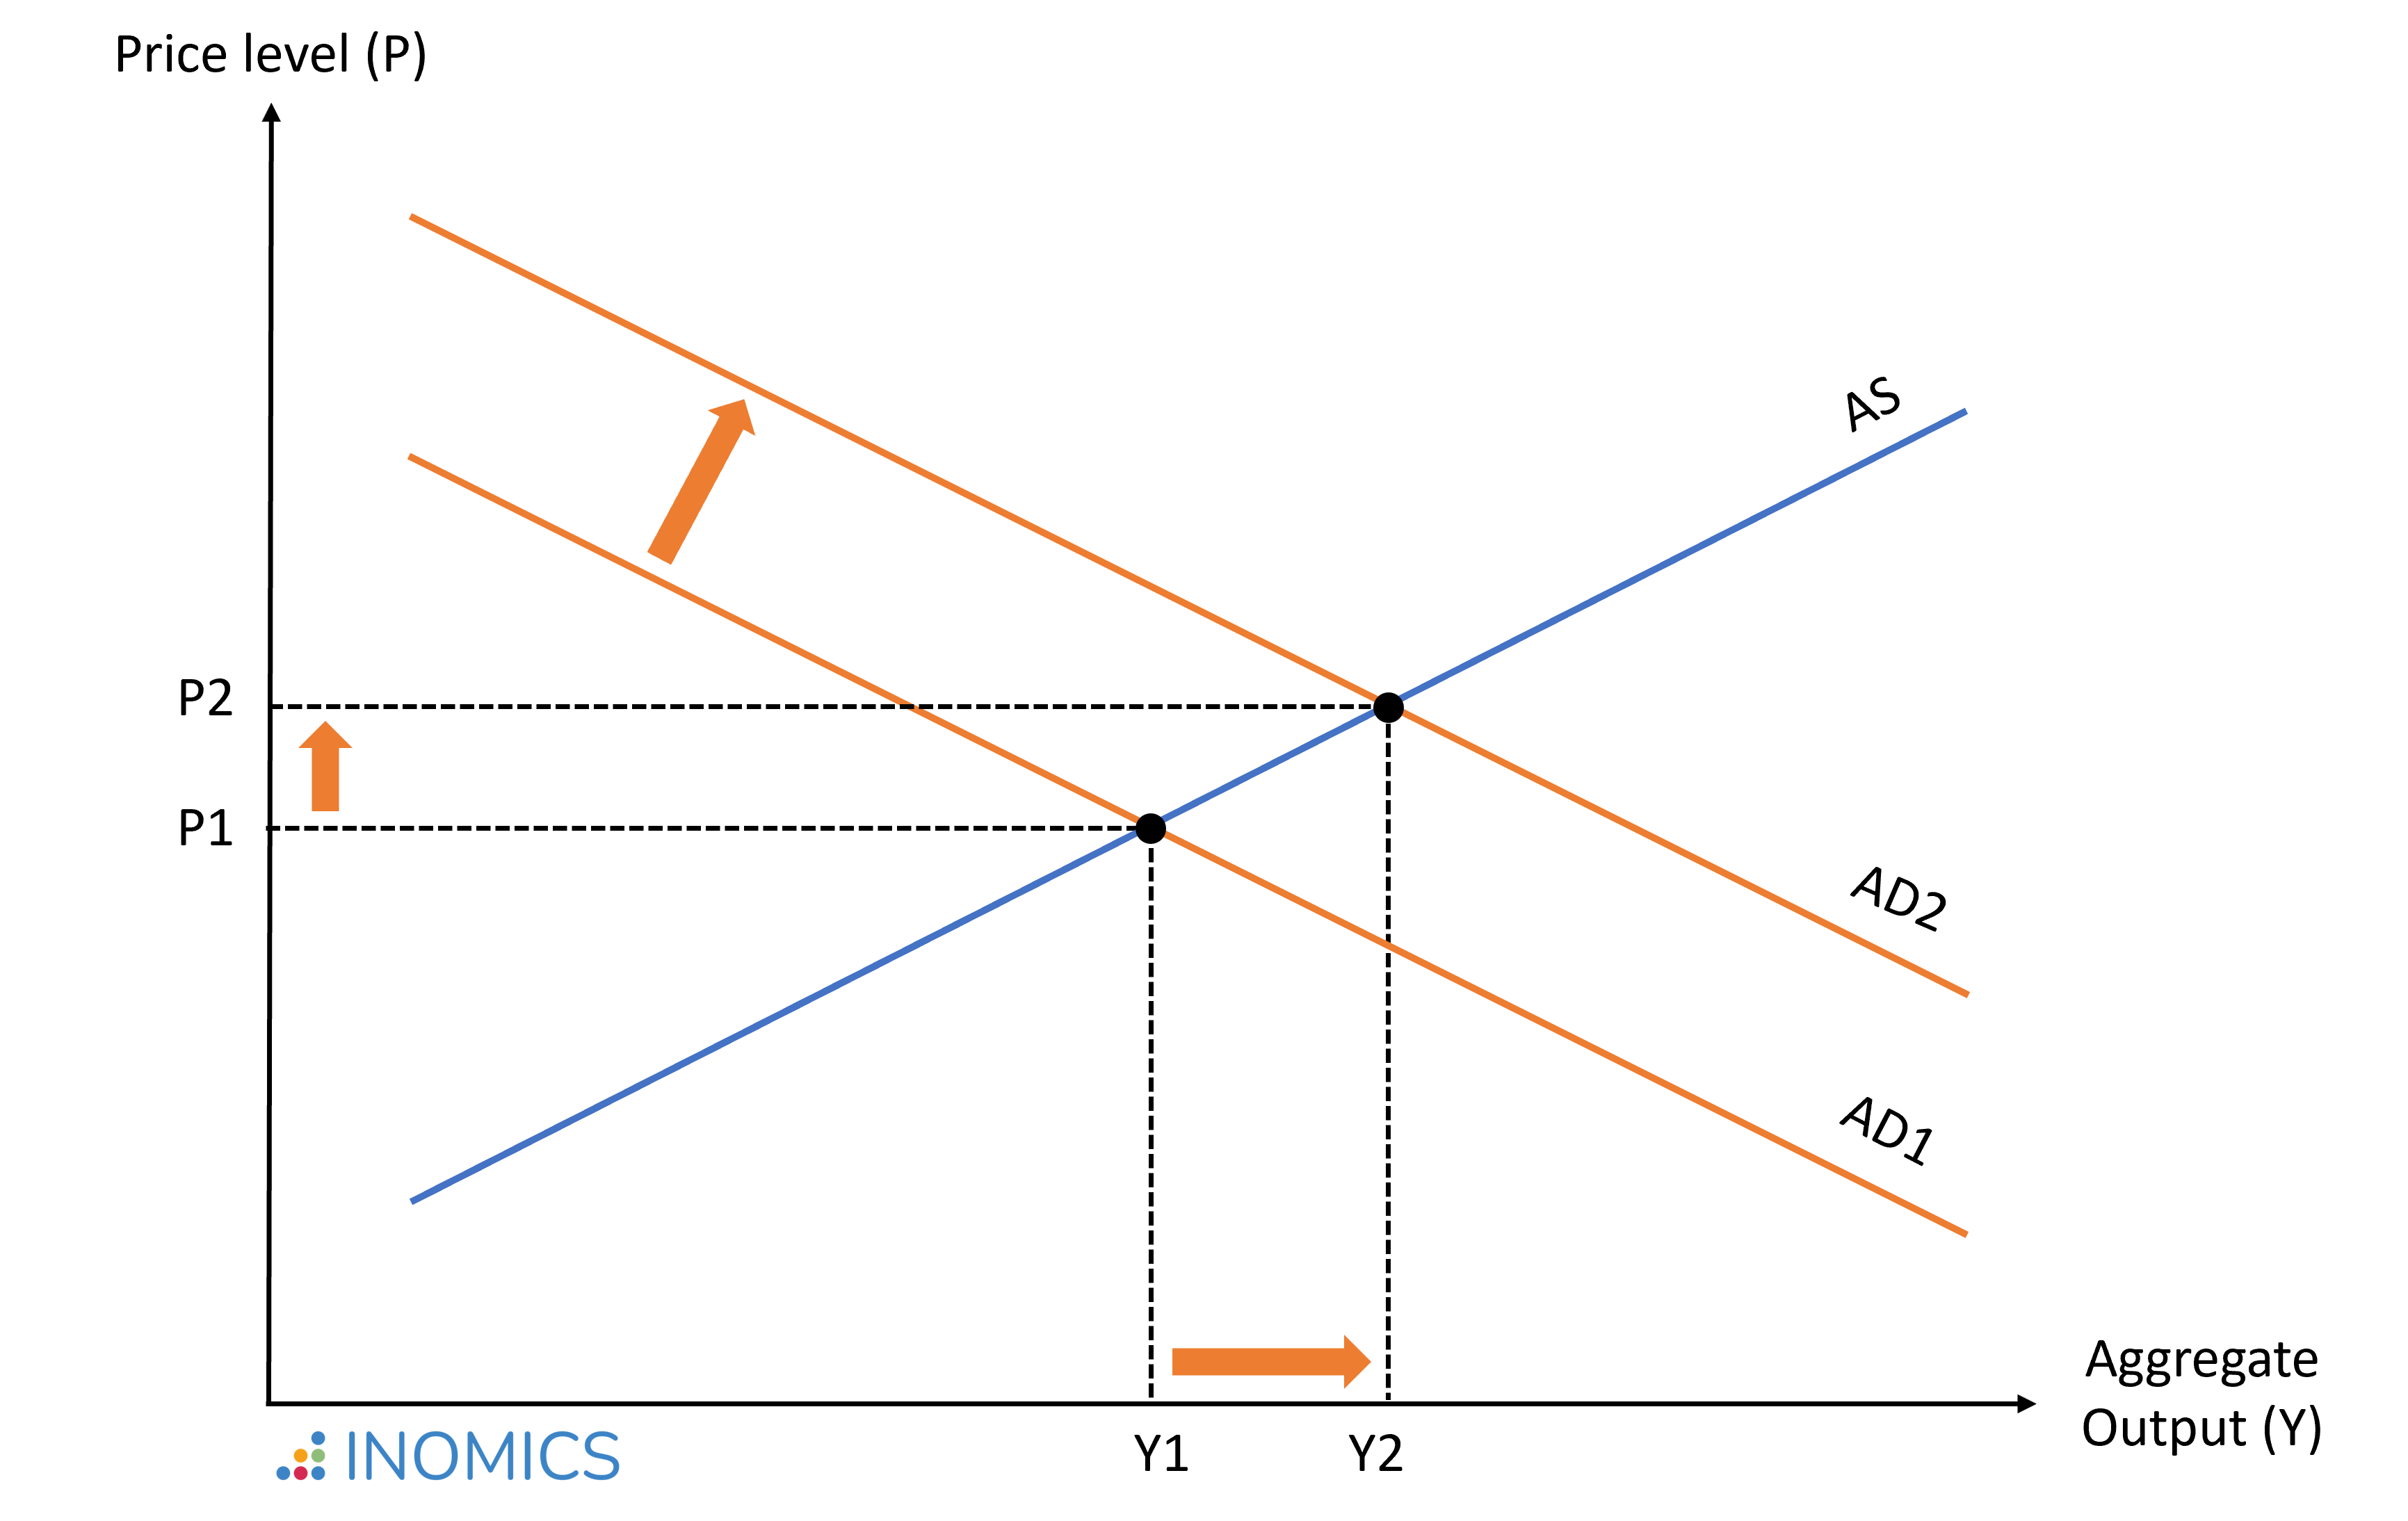
Figure 1: A depiction of demand-pull inflation
Cost-push inflation
Cost-push inflation occurs when the aggregate supply of goods is reduced (the AS curve shifts inwards, as depicted below), while aggregate demand remains the same, thus driving up prices. This will often be caused by an increase in production costs, for example due to rising prices of raw materials. The higher production costs are passed on to consumers in the form of higher prices for finished goods.
A common cause of cost-push inflation are rising oil or gas prices. These affect transport costs and thereby lead to higher prices for a range of products. Natural disasters can also cause shortages in the supply of goods that drive up prices. For example, droughts or floods affect crop and pasture production and thereby can cause spikes in food prices.
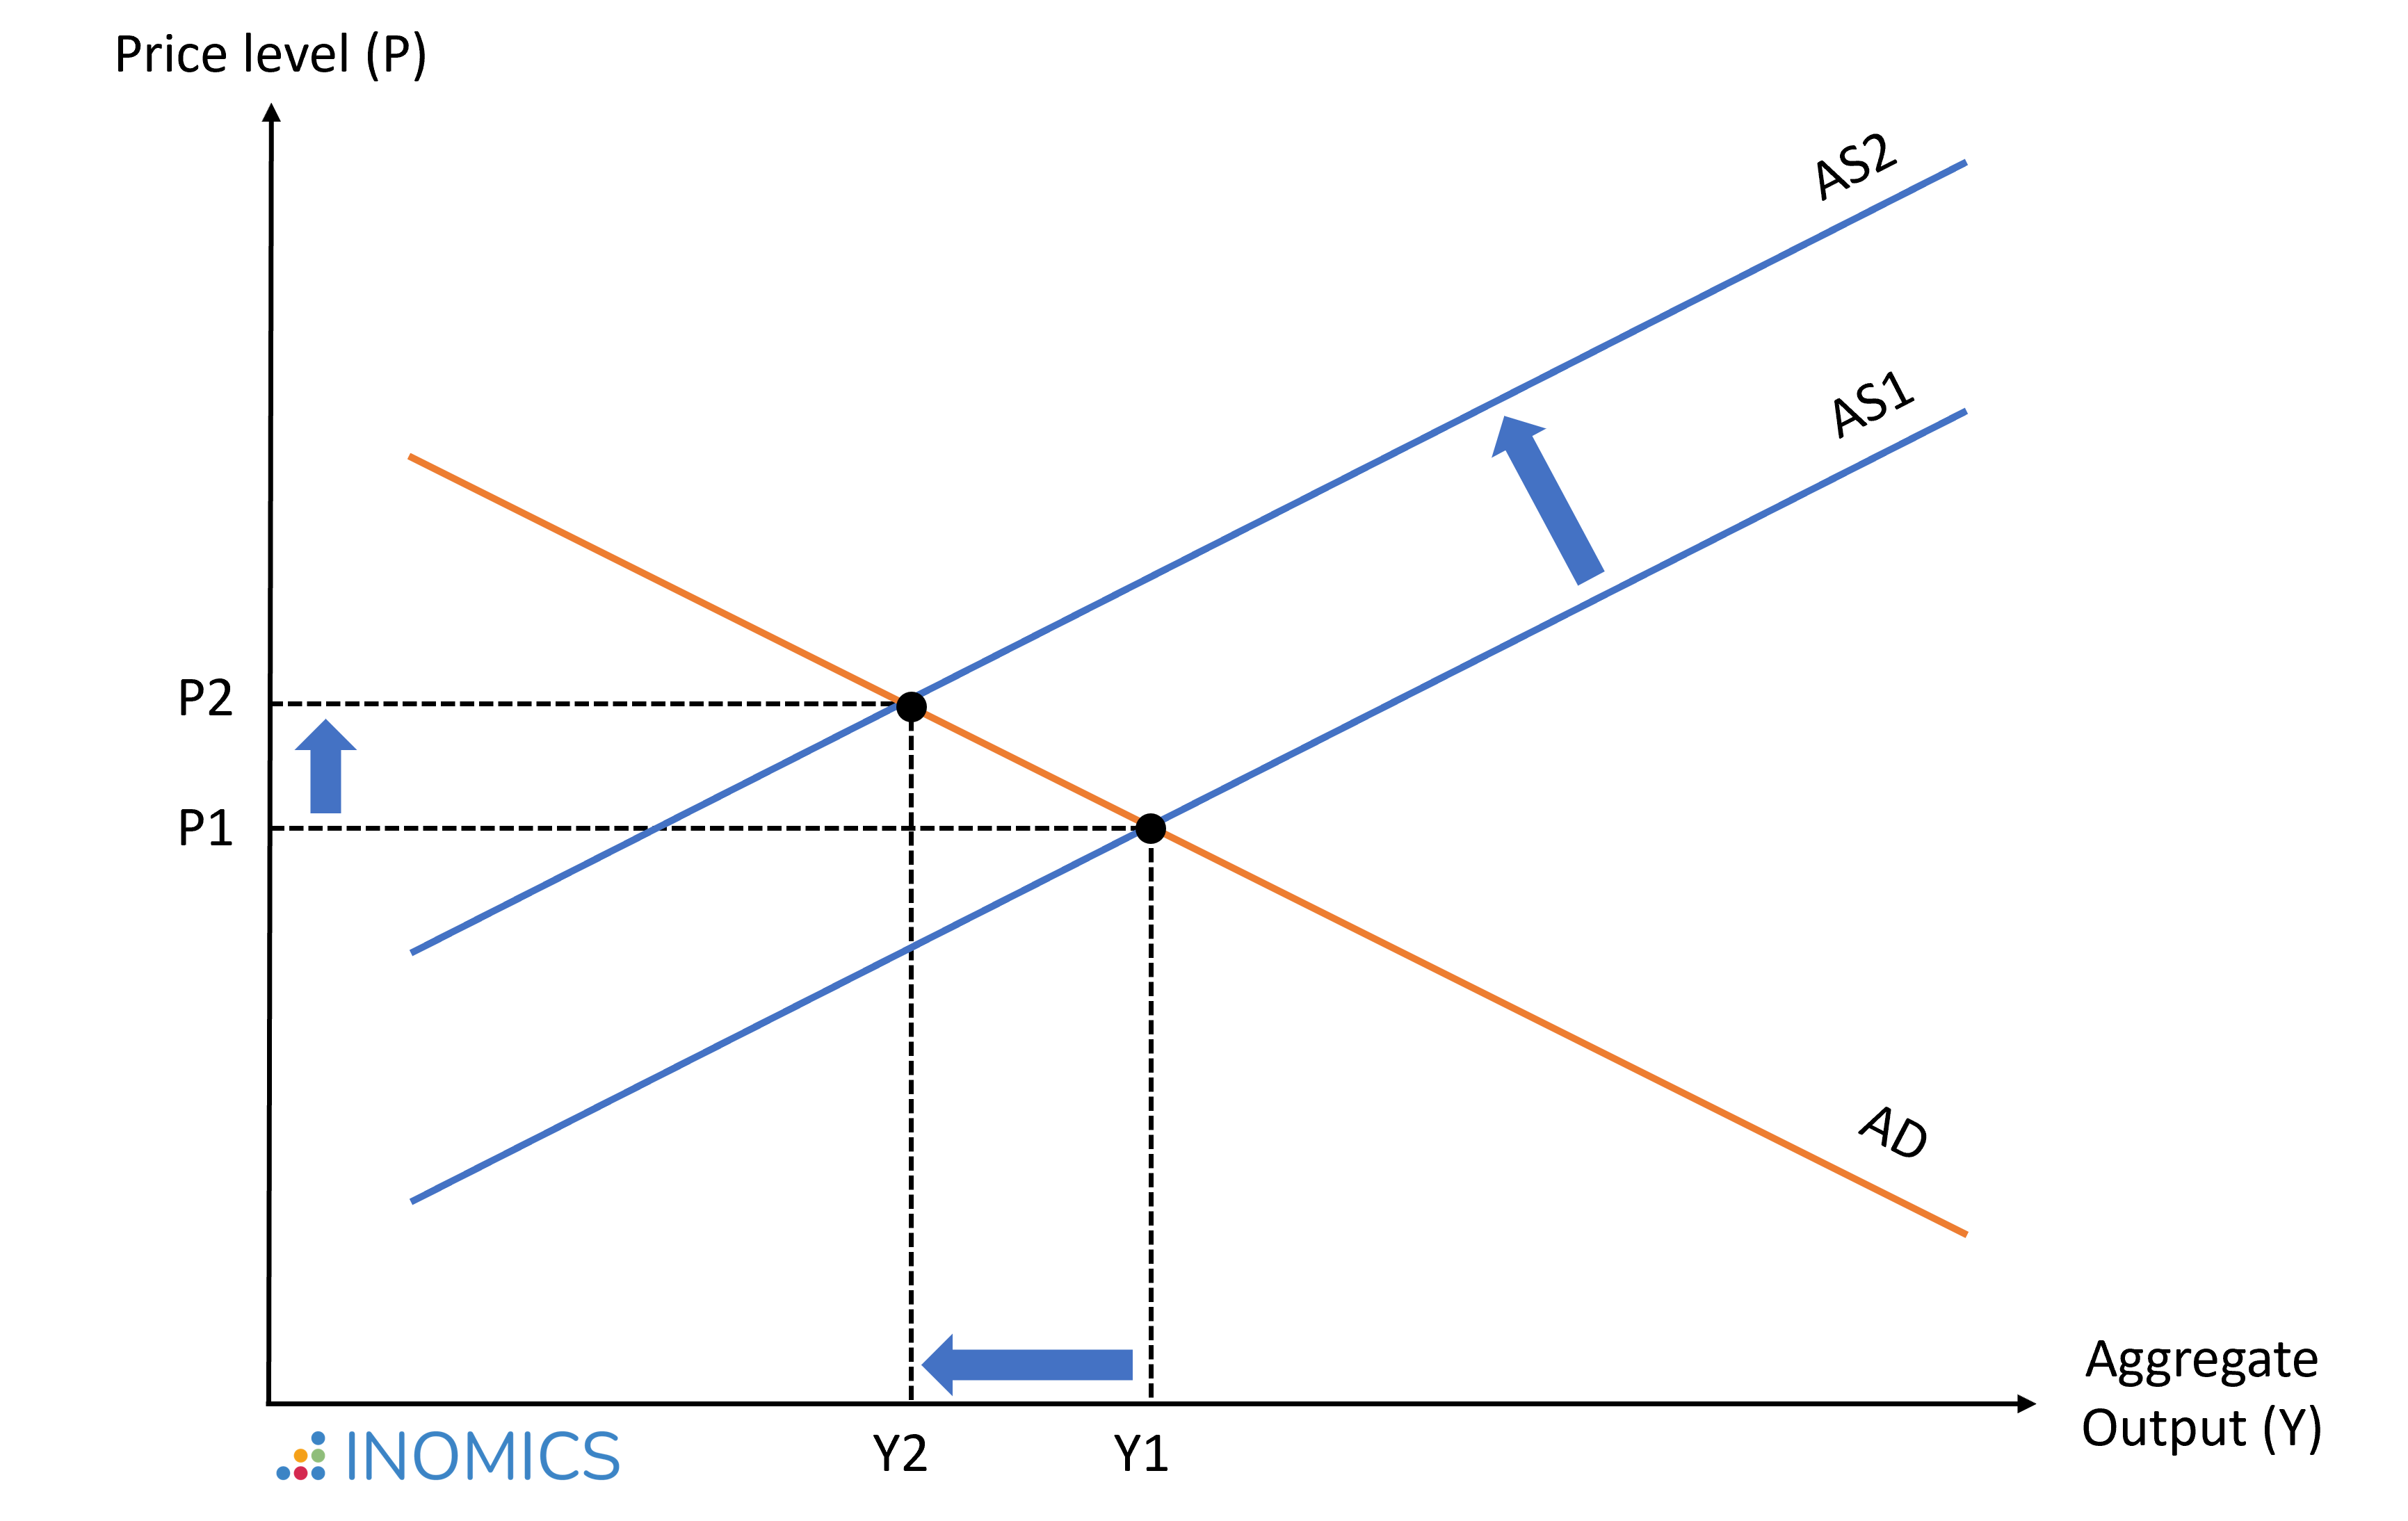
Figure 2: a depiction of cost-push inflation
Monetary inflation
According to the quantity theory of money, excess money creation is the primary driver of inflation. If money supply outpaces output growth, there will be more money available in the economy to spend on the same number of goods, thus causing the value of money to fall. Central banks use monetary policy to affect the amount of money circulating in the economy.
For example, common policy instruments to increase money supply include decreasing the interest rate, which reduces saving and increases spending; purchasing government bonds, which injects money to the economy; and lowering the reserve requirements for banks, which allows them to lend out more money.
In principle, central banks can also print more paper currency. However, historically instances of printing too much money in order to pay off debts have been the primary cause of very high and rapidly accelerating inflation. This situation is described as hyperinflation.
An alternative strategy used to increase the money supply is quantitative easing. This is where the central bank purchases long-term securities from the open market in order to increase the money supply. This strategy was recently used by the US central bank during the COVID-19 crisis to lessen the severity of the economic downturn.
Costs of inflation and countermeasures
Low and steady inflation can be a sign of economic growth. When the economy is performing well and unemployment is low, shortages in labor can occur. In this case, companies will increase wages to attract workers. This causes an increase in production costs, which translates into higher prices of goods for final consumption. At the same time, the rise in wages raises incomes and thus consumer spending, such that demand keeps up with the price increase.
However, especially in cases of cost-pull and monetary inflation, the prices for goods tend to change faster than wages, which are usually set by employment contracts. If inflation outpaces wage growth, this reduces the purchasing power of consumers - that is, in an inflationary environment, the same amount of money allows consumers to buy less goods than before. This erosion of real income causes a decline in living standards and is the biggest cost of inflation. In cases of hyperinflation, prices increase by 50 per cent or more within a month, with devastating effects for the economy and governance.
A low, stable, and predictable rate of inflation makes it easier for households and businesses to make sound decisions regarding saving, borrowing, and investment, which contributes to a well-functioning economy. This is why price stability is an important target of monetary policy.
Governments and central banks use various instruments of monetary policy to control inflation. The most common measures are adjustments to interest rates. Higher interest rates reduce spending and increase saving. With less disposable income being spent, the economy slows and inflation decreases.
Measures of Inflation
The percentage change in the consumer price index (CPI) over a given period is the most widely used measure of inflation. The CPI measures price changes for a nationally representative basket of everyday goods – including items such as milk, fruit, cereal, and coffee, as well as expenses for housing, transport, clothing, health, education, and recreational activities. It is indexed to the cost of this basket in a base period and then tracks its evolution, to indicate whether prices are rising (inflation) or decreasing (deflation).
An alternative way to calculate the inflation rate is the percentage change in the GDP deflator from the previous year’s GDP deflator value. The GDP gives the market value of all final goods and services produced within a country during a given time period, and the GDP deflator measures how the prices of these goods have changed over time, relative to a base period.
The items and quantities that enter into the calculation of GDP vary year by year and are therefore more current than the mostly fixed CPI basket. GDP, however, also includes non-consumer items (such as military spending), which is why the CPI basket is the preferred indicator for changes in the cost of living in a country.
Good to know
The main task of the European Central Bank (ECB) is to maintain price stability. The Harmonised Index of Consumer Prices (HICP) is used to measure changes in the prices of consumer goods and services purchased by households in the euro area. It is 'harmonized' in the sense that all the countries in the euro area follow the same methodology to ensure comparability.
Between 2000 and 2021, the average inflation rate in the euro area was 1.7%. Inflation was relatively stable at around 2% in the early 2000s, before rising to up to 4% during the financial crisis of 2007-2008. Since then, there have been stronger fluctuations. In September 2020, the euro zone glided into deflation (negative inflation) for the first time in four years, which was followed by a sharp rise to 5% inflation in December 2021.
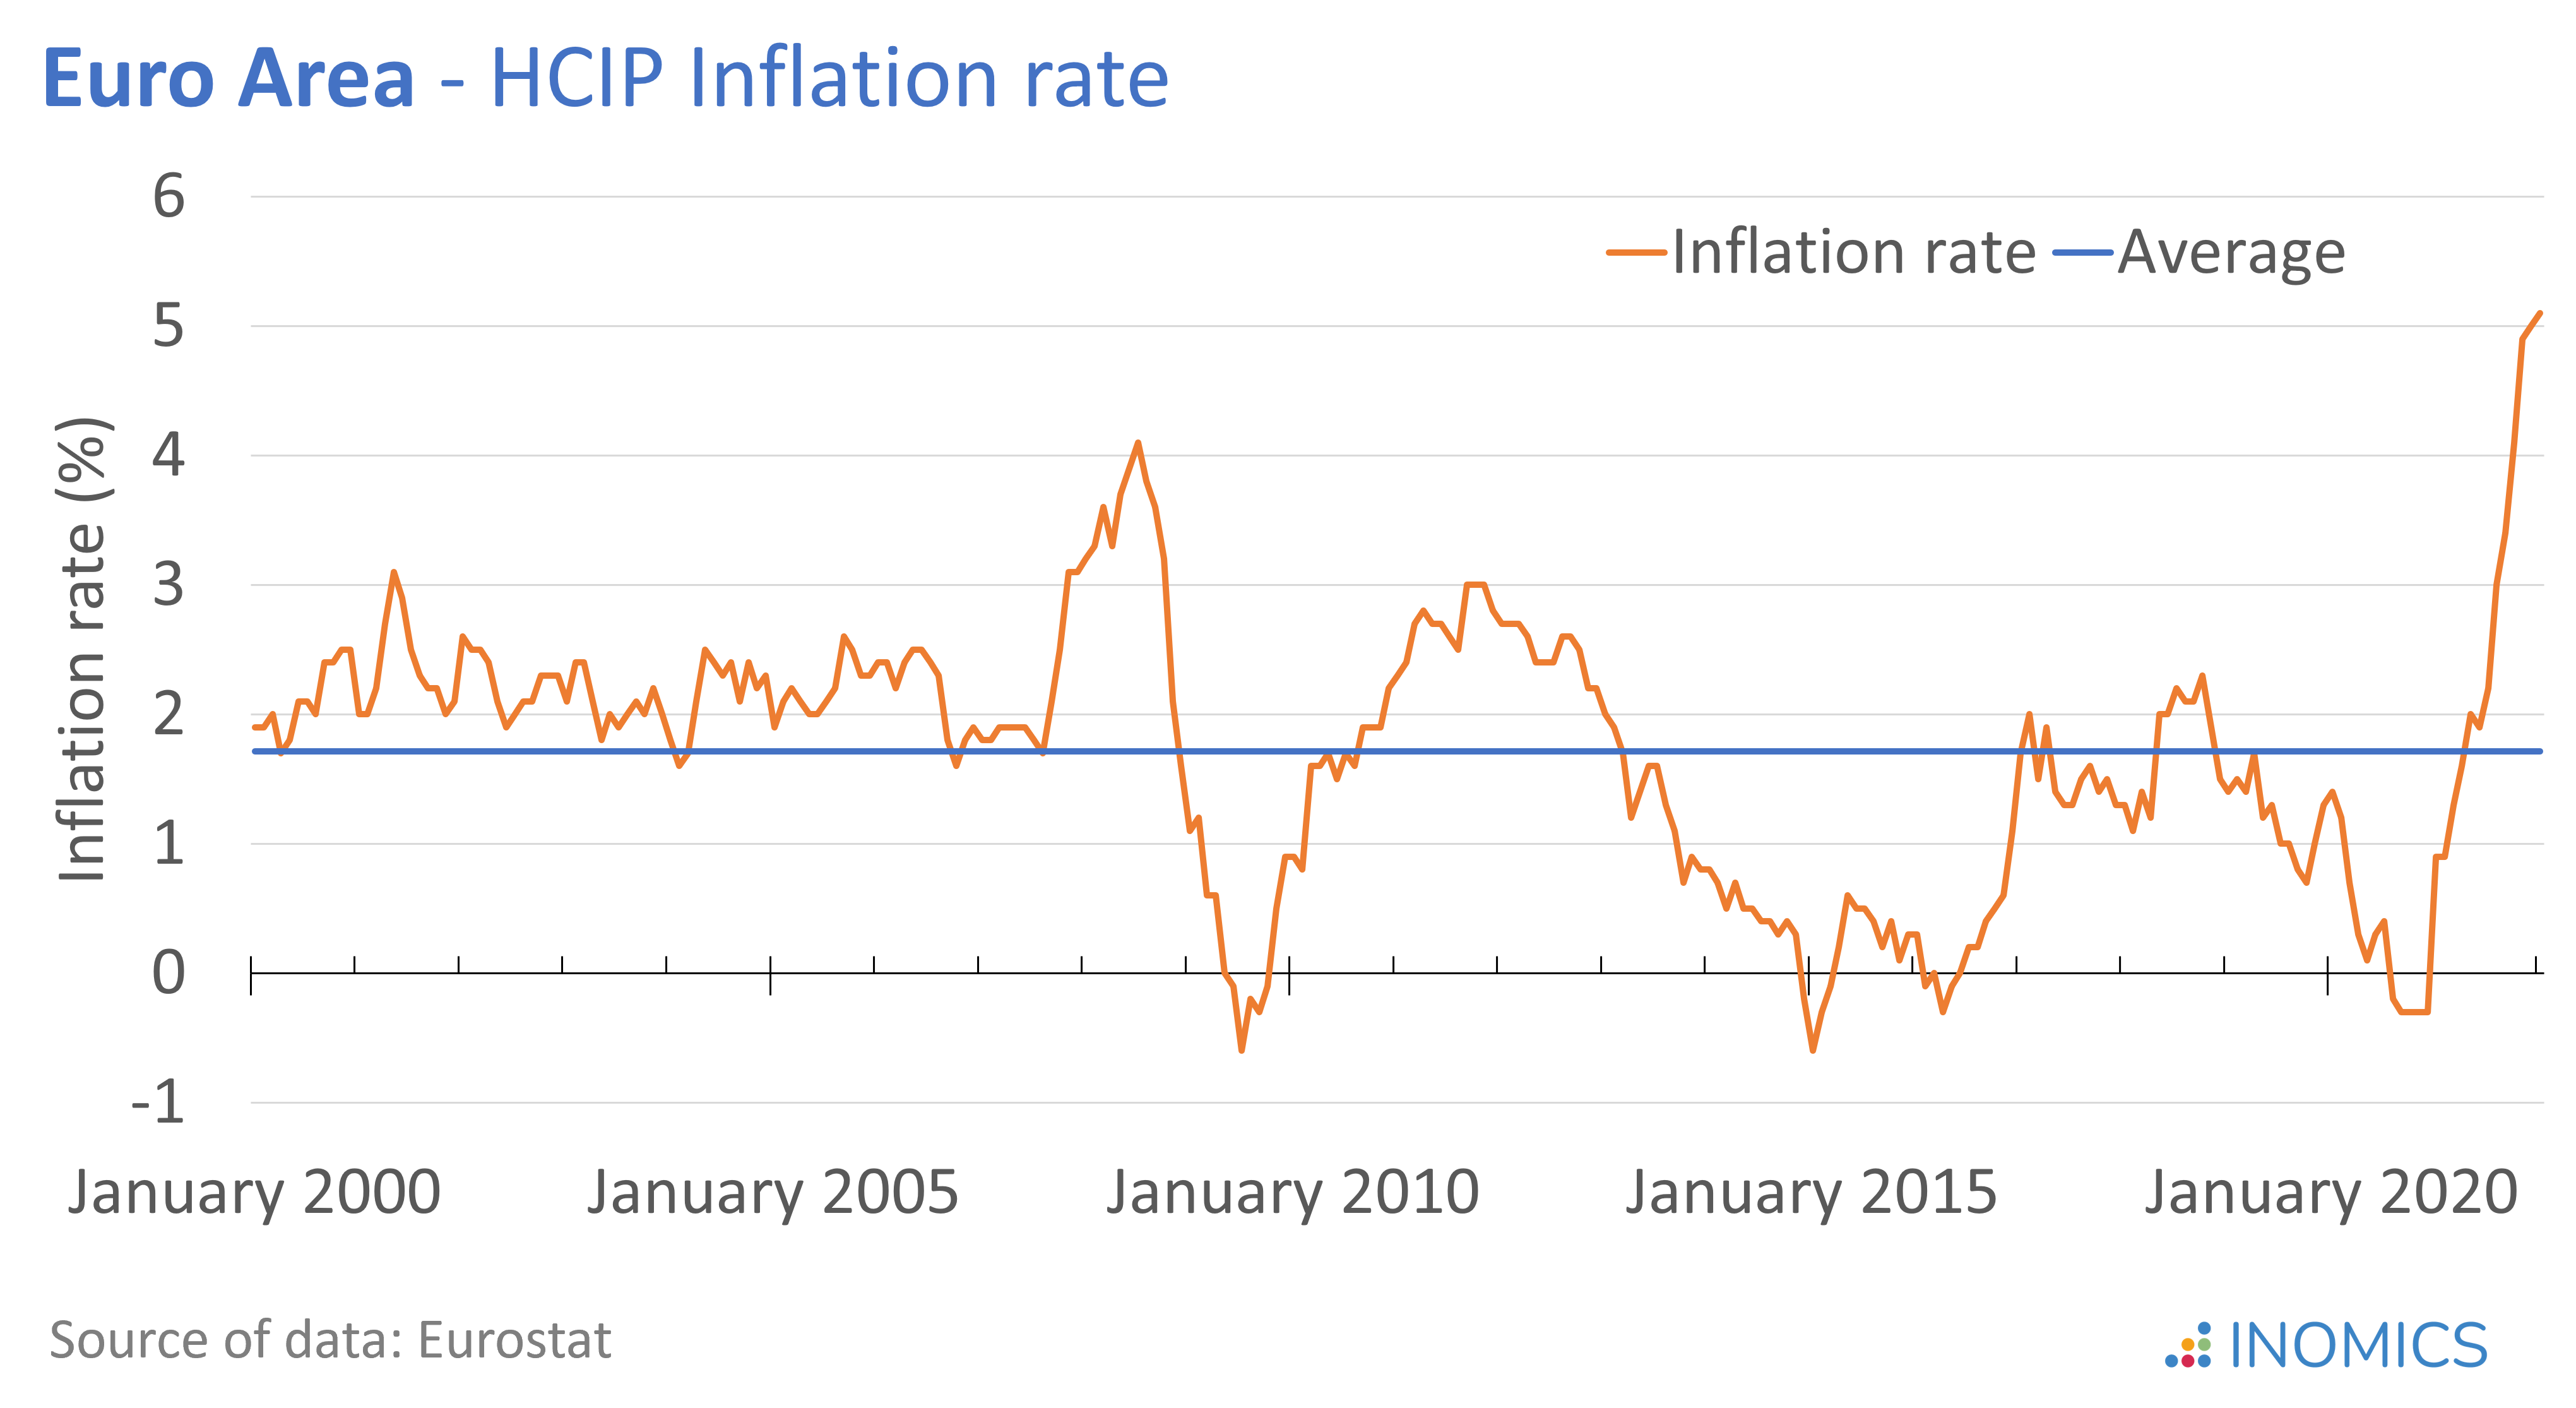
The pronounced rise in the euro area HICP inflation in late 2021 and the start of 2022 was caused by energy price developments. Rising energy prices pushed up expenses for housing (electricity, gas, etc.) and transport by about 10% from November to December 2021. Energy price inflation was driven both by oil price increases and by base effects linked to the COVID-19-related collapse in oil prices at the beginning of 2020.
-
- Postdoc Job
- Posted 2 weeks ago
Postdoc (m/f/x)
in Trier, Germania
-
- PhD Candidate Job
- (Hybrid)
- Posted 5 days ago
Mehrere Doctoral Researcher (m/w/d) Für das Team "Forschung für die Finanzaufsicht"
At Deutsche Bundesbank in Frankfurt am Main, Germania
-
- Assistant Professor / Lecturer Job
- Posted 2 weeks ago
Assistant Professor - Economics
At Salisbury University in Salisbury, Stati Uniti
Currently trending in Stati Uniti

Related Items


Featured Announcements


Prossime Scadenze
- Lug 26, 2026
- Lug 26, 2026
- Lug 29, 2026
- Lug 31, 2026
- Lug 31, 2026


