Economics Terms A-Z
Welfare Economics
Read a summary or generate practice questions using the INOMICS AI tool
Welfare economics is the study of how a given allocation of goods and resources in a society affects economic well-being. It seeks to guide public policy toward an allocation that benefits society overall. As such, it provides the tools to compare between different resource allocations and evaluate them from a social welfare perspective – or in layman's terms, to judge how "fair" those allocations are. There are three core concepts used in welfare analysis: total surplus, allocative efficiency, and the social welfare function.
Total Surplus
In a stylized model, the total market surplus denotes the total welfare of all participants in a market. It is the sum of consumer surplus and producer surplus, which can be understood as the net gain to society from all trades (or transactions) that are made in that market.
- An individual's consumer surplus is the difference between the highest price they are willing to pay for a product and the price they actually pay. The area below the demand curve and above the market price is the total consumer surplus summed up for all consumers in the market.
- A producer's surplus is the difference between the lowest price they would be willing to accept, considering production costs, and the price the product is actually sold for. The area above the market supply curve and below the market price is the total producer surplus summed up for all producers in the market.
In the market equilibrium where supply equals demand (denoted by P* and Q* in the figure below), the sum of consumer and producer surplus – and thus total welfare – is maximized.
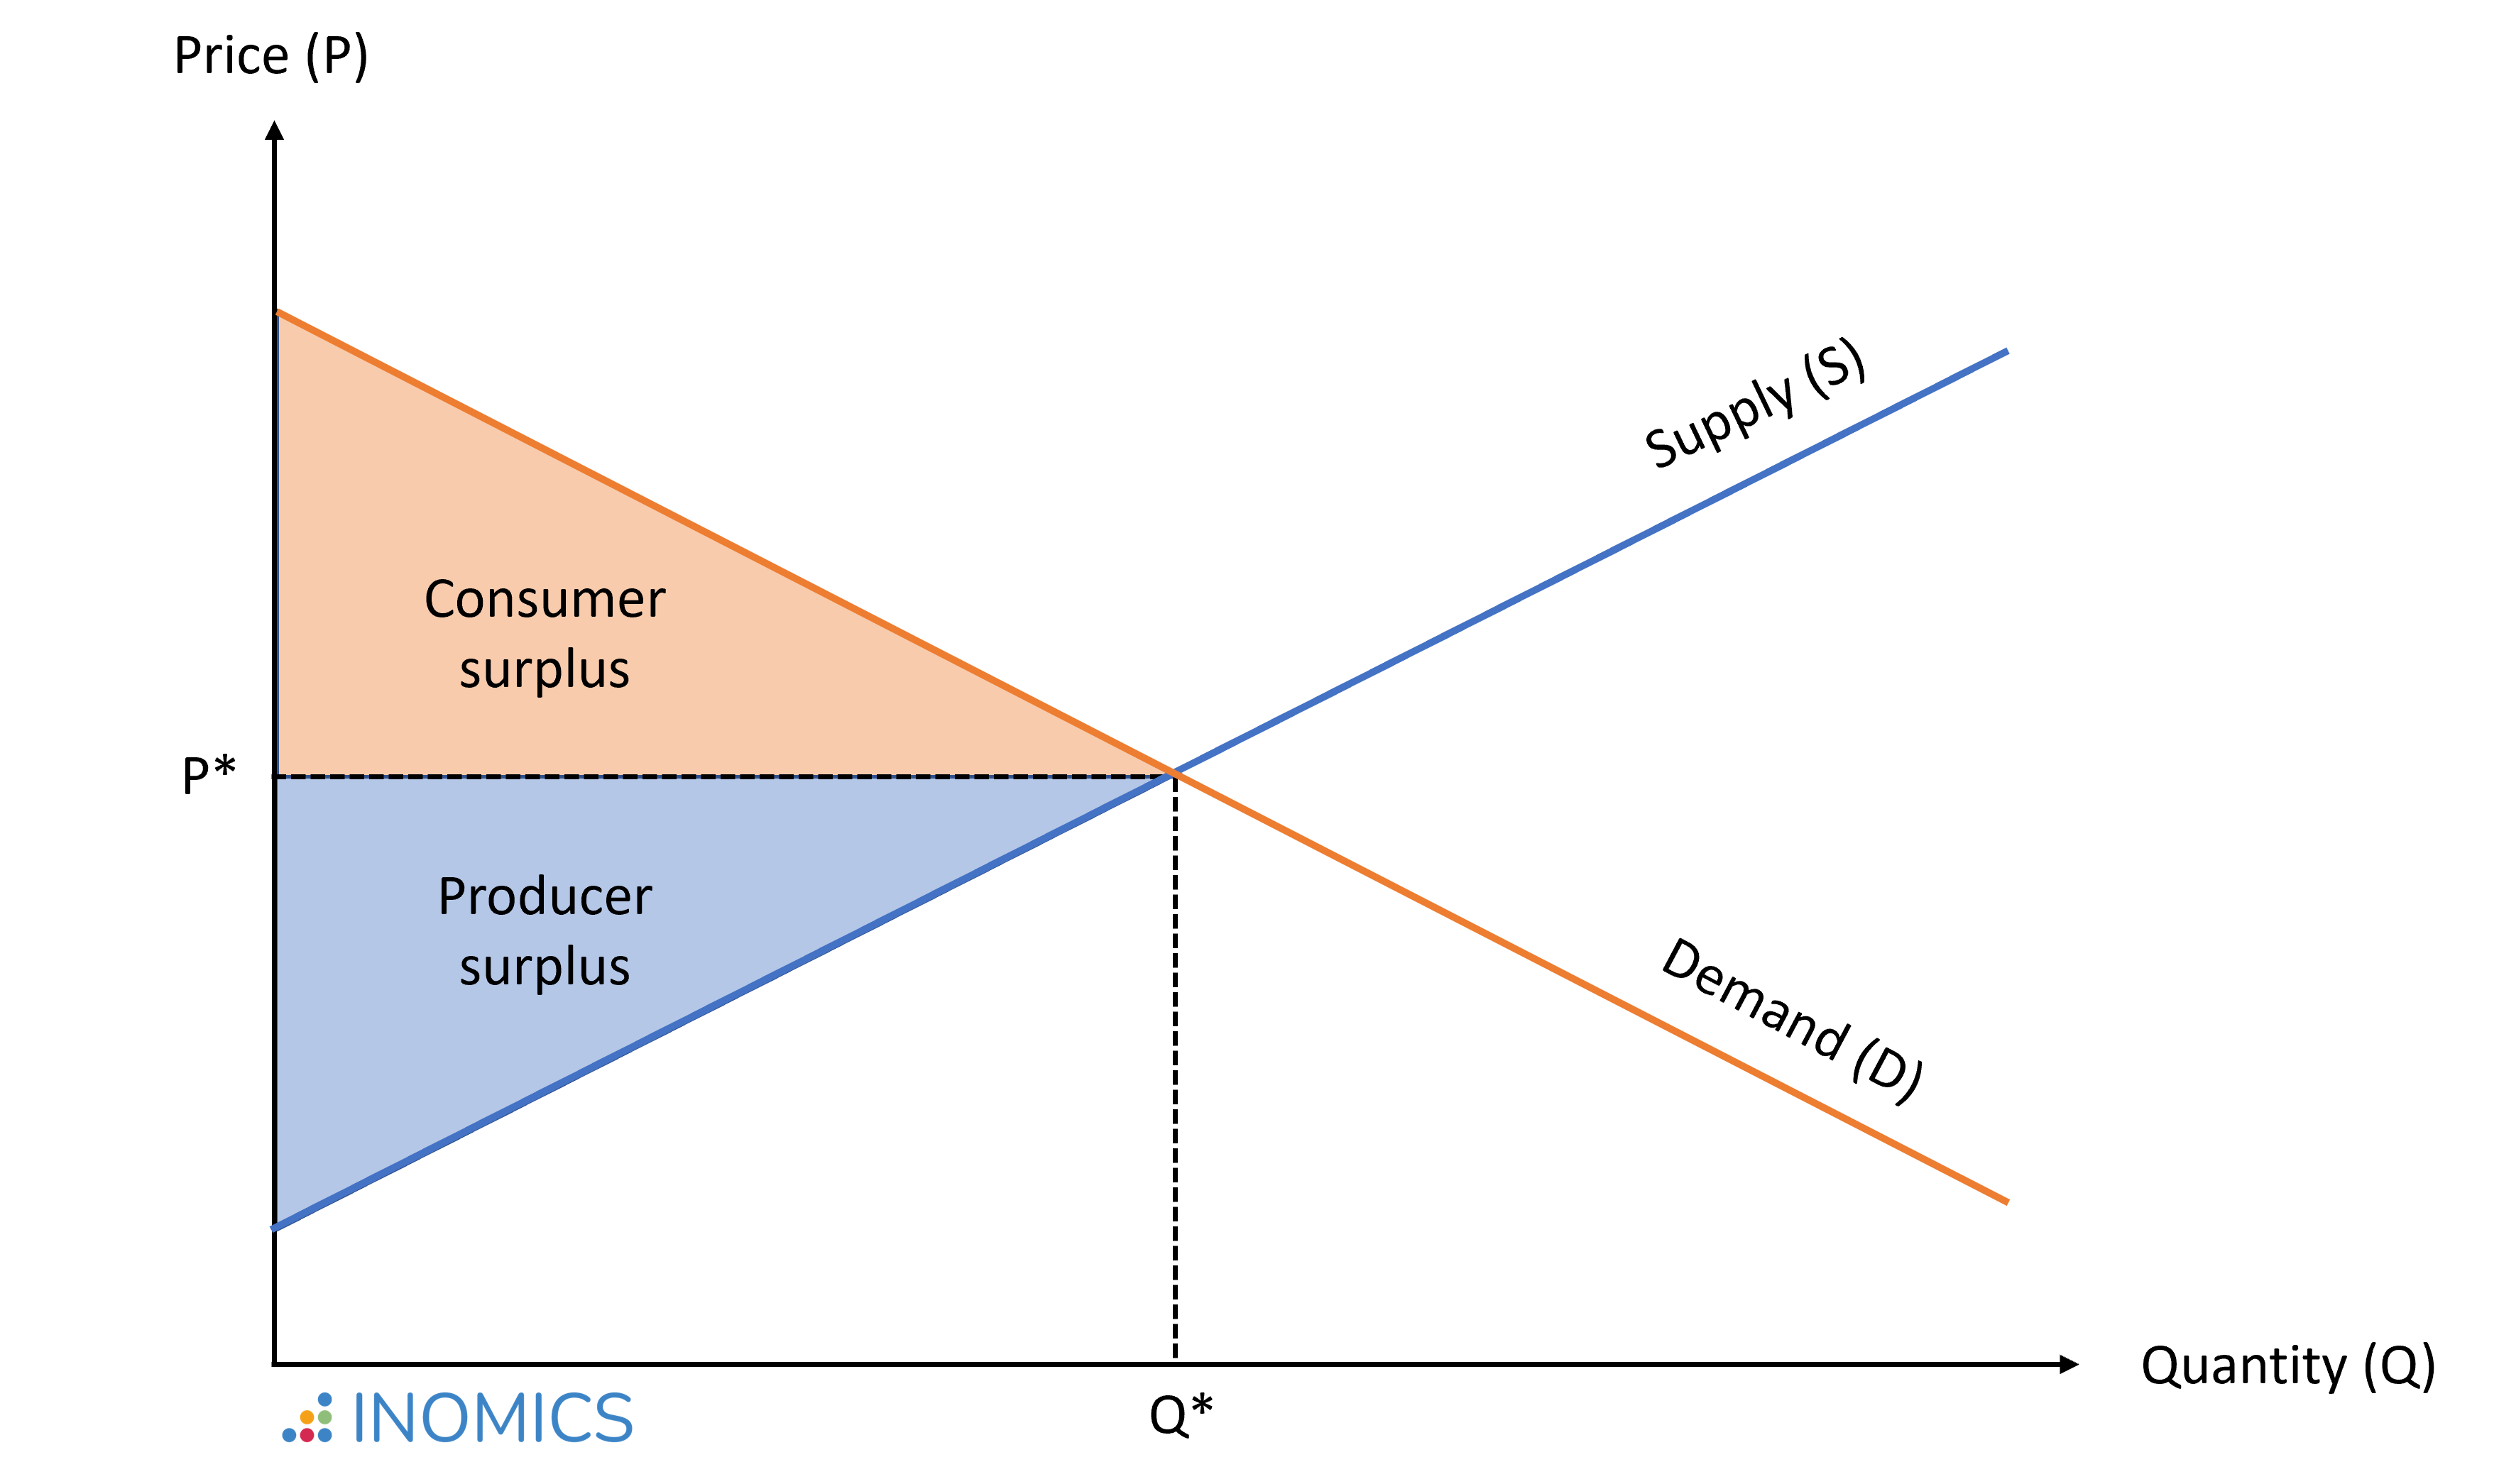
Figure 1: Welfare maximized in a perfectly competitive market
In case of market inefficiencies, where the quantity traded on the market diverges from the socially efficient outcome, social welfare remains below the optimal outcome. For example, if market power allows producers to charge a price P' > P*, this reduces the quantity traded to Q' < Q*.
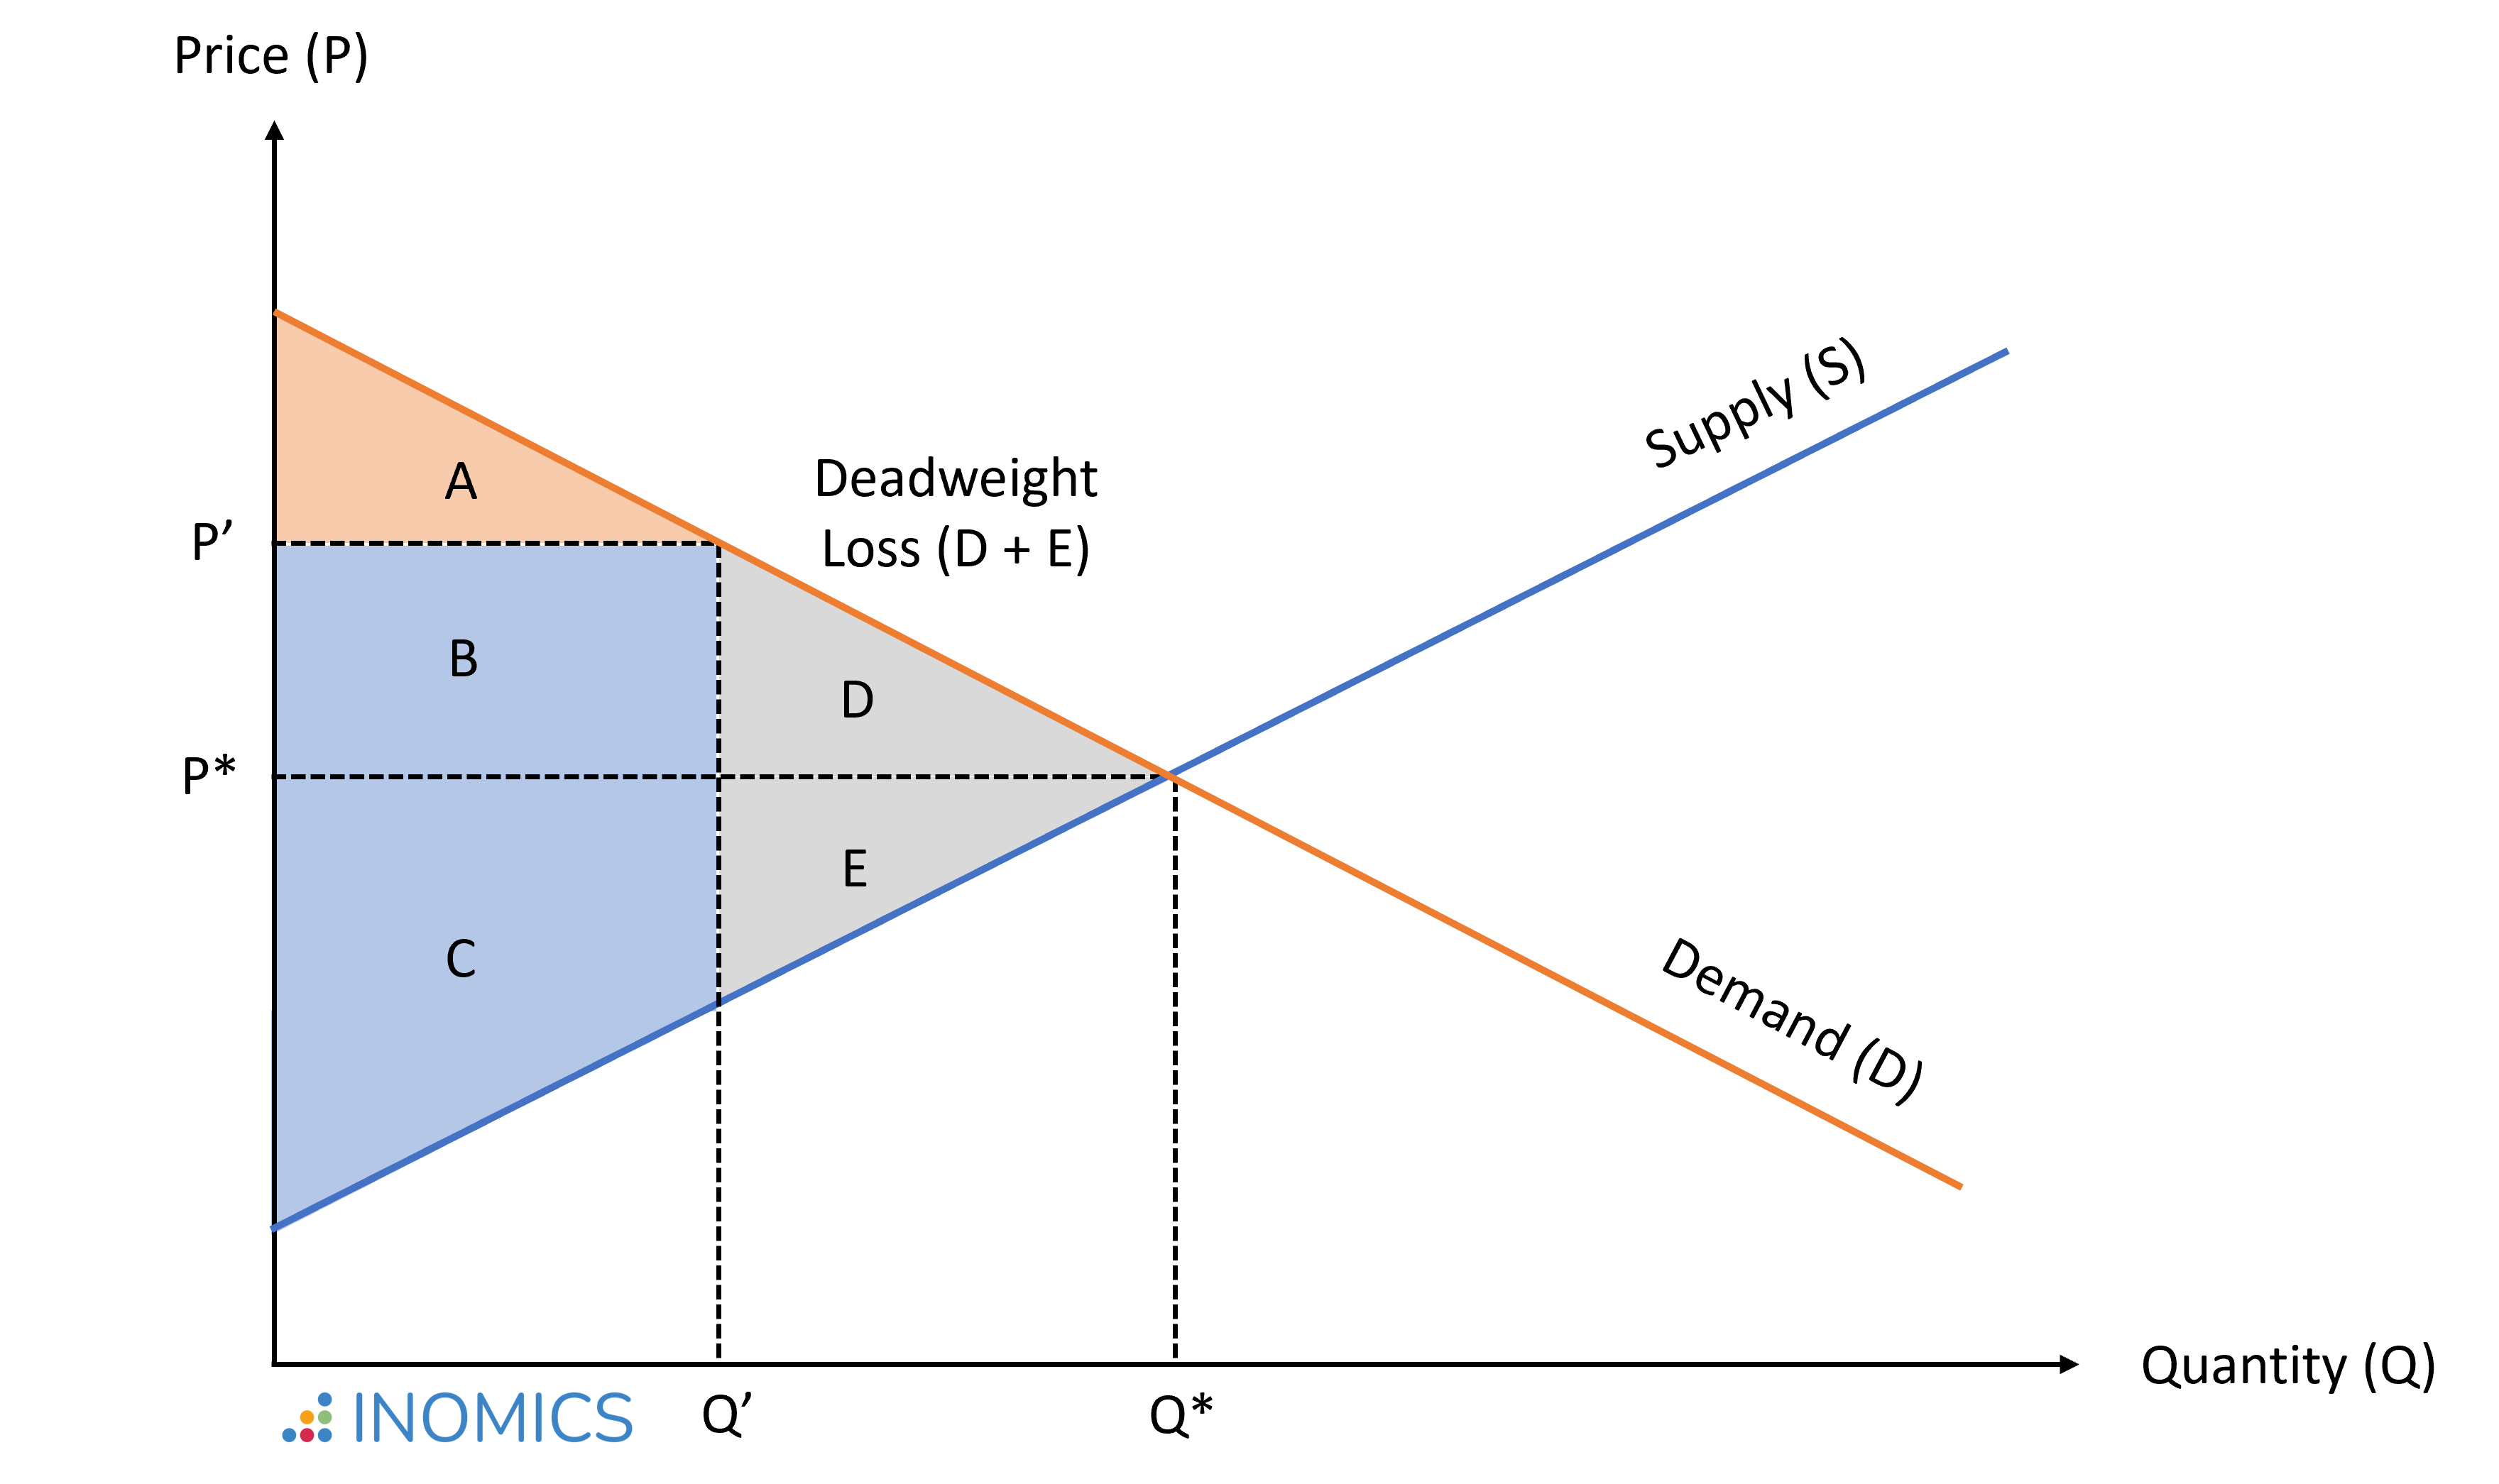
Figure 2: Welfare reduced in an inefficient market exhibiting deadweight loss
In this situation, the consumer surplus (CS) is lower than in equilibrium:
\begin{equation*}
CS' = A < CS^* = A + B + D,
\end{equation*}
while the producer surplus (PS) is higher than in equilibrium:
\begin{equation*}
PS' = B + C > PS^* = C + E.
\end{equation*}
While area B is transferred from consumers to producers as a consequence of a price increase, areas D + E reflect the deadweight welfare loss; that is, the cost to society created by market inefficiency:
\begin{equation*}
W^* - W' = (CS^* + PS^*)-(CS' + PS') = D + E.
\end{equation*}
In situations where market failure leads to an inefficient distribution of goods and services – like the one illustrated above – it is possible to find an alternative allocation that makes at least one person better off, without making anyone else worse off – thus improving social welfare. In these situations, government intervention can potentially improve everybody’s welfare.
In the above example, if prices and quantities were set at the equilibrium values (P*, Q*), the government could charge a lump-sum consumer tax of the size of area B. Then, it could provide this amount as a lump-sum subsidy to producers, increasing the consumer surplus by area D and the producer surplus by area E. This would eliminate the deadweight loss; the total surplus would be the same as in the competitive equilibrium.
Pareto Efficient Allocations
An allocation is said to be Pareto efficient (or Pareto optimal) when no further exchange is feasible that would make at least one person better off without making any other person worse off.
The first theorem of welfare economics states that when there exists (1) no externality; (2) perfect competition; (3) perfect information (as opposed to asymmetric information); and (4) fully rational agents, then all competitive equilibria are Pareto efficient. These equilibria form the Pareto frontier (also called Pareto set). This is illustrated in the figure below for an economy with two agents (1 and 2). The blue-shaded area represents all combinations in utility (u) that would be feasible to attain, but are not efficient since resources are left unused. The orange line indicates the Pareto frontier where all resources are used and nobody can be made better off without making someone else worse off.
Importantly, Pareto efficiency defines optimality only in a limited sense, as it does not allow "fairness" ranking between different Pareto efficient allocations. For instance, it does not distinguish between outcomes A and B in the figure below, even though outcome A generates substantial inequality compared to outcome B.
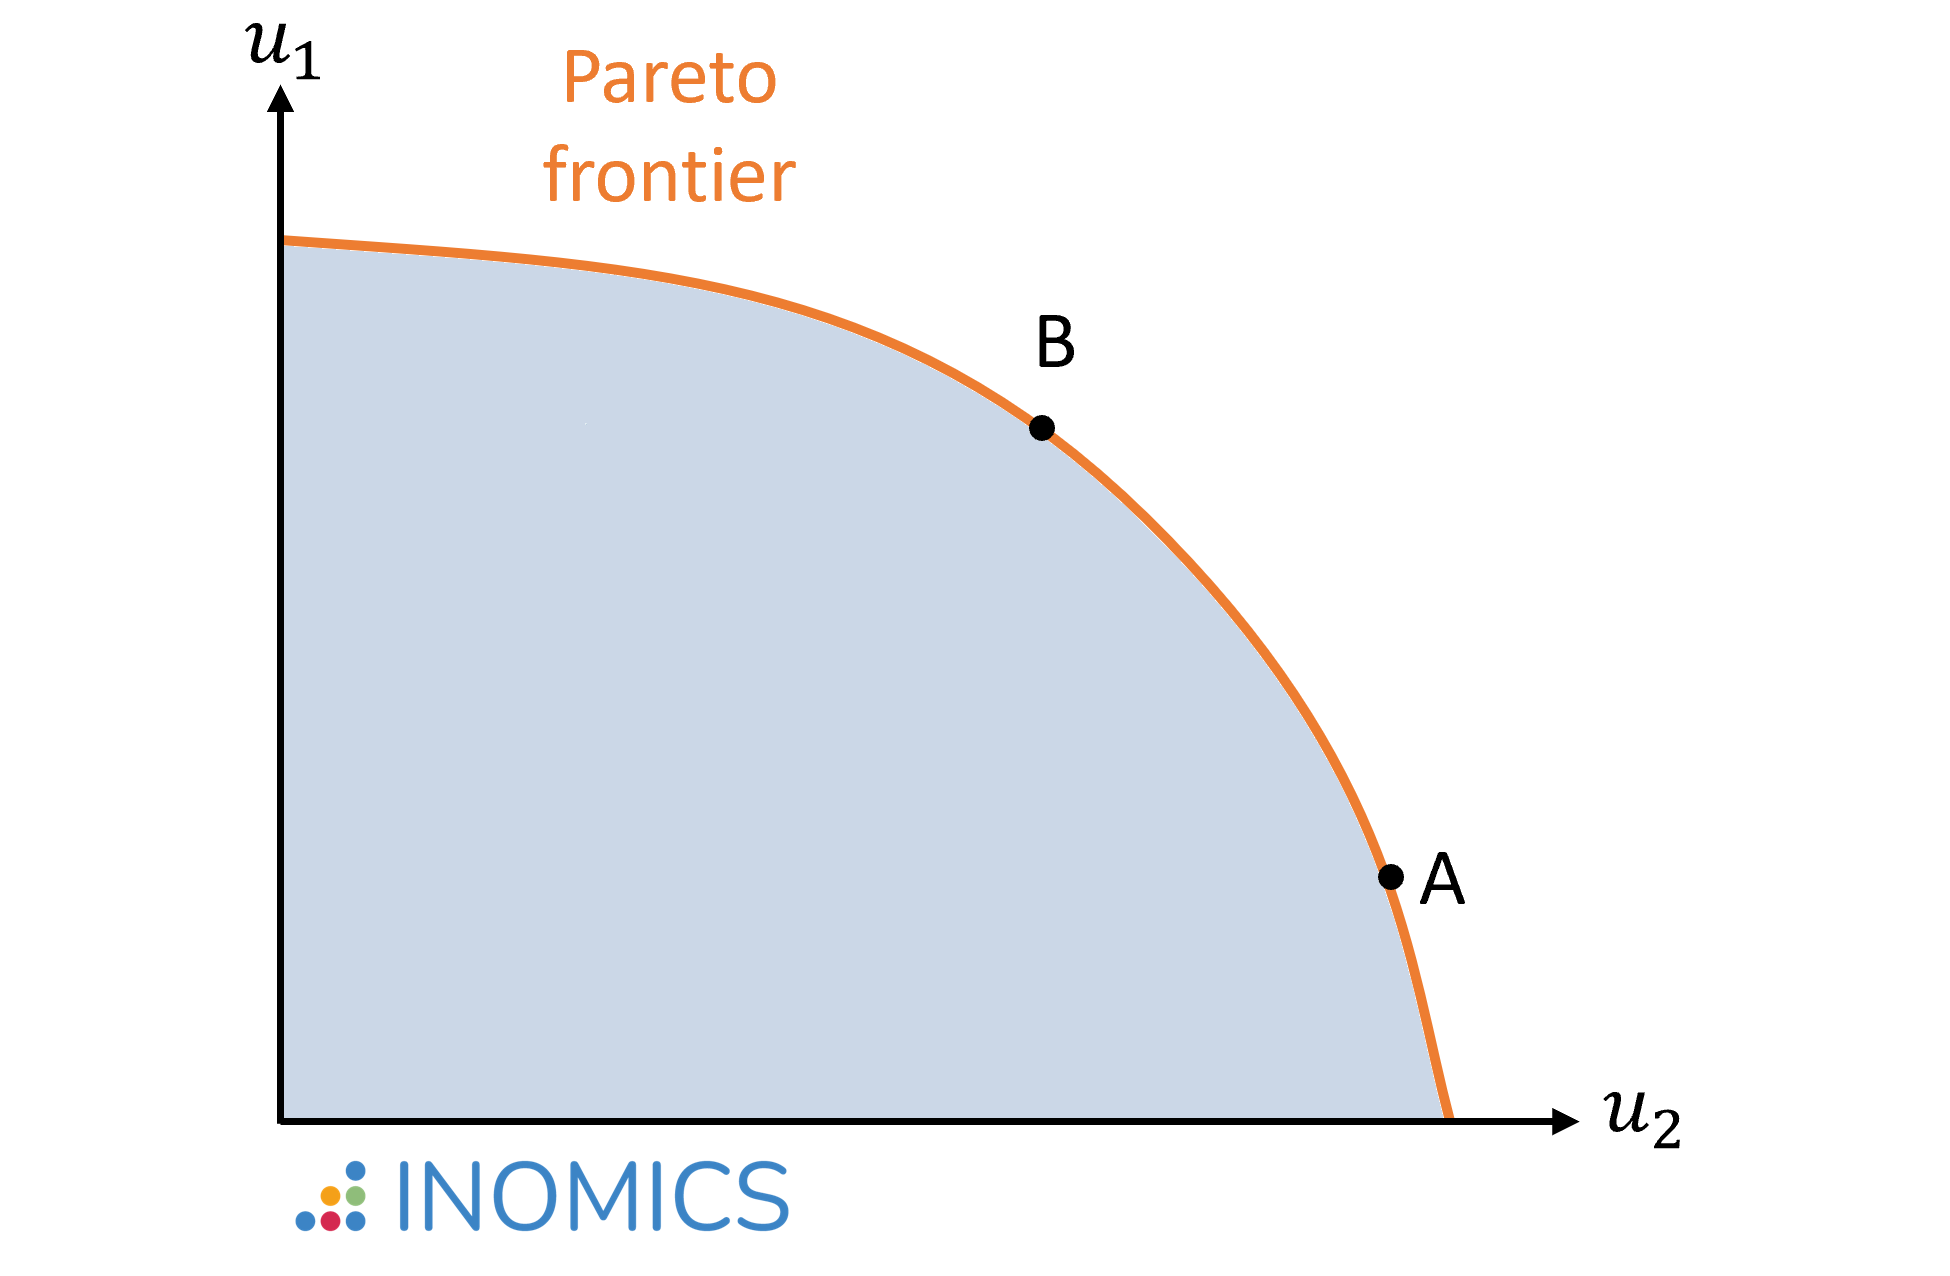
Figure 3: a Pareto frontier
Social Welfare Function
To rank different resource allocations in terms of their social desirability, economists typically use a social welfare function, W(u1, u2,...,uH). The social welfare function is non-decreasing in individual well-being, W'(uH) > 0, and therefore achieves a maximum at some Pareto optimum.
To give a more concrete example, imagine a situation at a daycare center. There are two children, Lisa (L) and Tom (T), and two toys, a book (B) and a puzzle (P). The teacher is thinking about how to allocate the toys between the children. Both children like both toys, but Lisa likes puzzles better than books, while Tom likes both equally.
Let's assume that Lisa derives utility uL(P) = 5 from solving the puzzle, and utility uL(B) = 2 from reading the book. Tom derives utility uT(P) = uT(B) = 2 from either activity. The following allocations and utility combinations would be feasible, assuming an additive utility and social welfare function:
\begin{equation*}
\text{Lisa: B,P; Tom:} \emptyset \quad \Rightarrow \quad
W = u_L(P,B) + u_T(\emptyset) = (5+2) + 0 = 7 \\
\text{Lisa: B; Tom: P} \quad \Rightarrow \quad
W = u_L(B) + u_T(P) = 2 + 2 = 4 \\
\text{Lisa: P; Tom: B} \quad \Rightarrow \quad
W = u_L(P) + u_T(B) = 5 + 2 = 7 \\
\text{Lisa: } \emptyset; \text{Tom: B,P} \quad \Rightarrow \quad
W = u_L(\emptyset) + u_T(P,B) = 0 + (2+2) = 4
\end{equation*}
In this setting, the second allocation would not be efficient. By exchanging the toys, a Pareto improvement can be reached: If Tom gives the puzzle to Lisa and Lisa gives the book to Tom, Lisa's utility increases, while Tom's utility stays the same.
Similarly, the fourth allocation leaves room for improvement. If Tom gave the puzzle to Lisa and only kept the book, aggregate welfare would increase. However, this would not be Pareto efficient, because Tom's utility would decrease unless he was compensated somehow. Lisa could compensate Tom for giving away the puzzle, as her welfare gain from the exchange is larger than his welfare loss.
For example, Lisa could offer to read the book to Tom, if he gave her the puzzle. If this compensation (C) brings a utility cost of uL(C) < uL(P) for Lisa and a utility gain of uT(C) ≥ uT(P) for Tom, then a Pareto improvement is reached by `trading' the puzzle for compensation. If, say, reading the book to Tom brings a utility cost of uT(C) = 2 for Lisa and a utility gain of uT(C) = 2 for Tom, aggregate welfare after the exchange would be W = uL(P) - uL(C) + uT(B) + uT(C) = (5-2) + (2+2) = 7. In a market with money, the obvious solution is to have adult Lisa pay adult Tom an amount of money x that satisfies (if utility is measured in terms of money) uT(P) ≤ x ≤ uL(P).
Both the first and the third allocation in the example list above are Pareto efficient. No child can be made better off without making the other worse off. However, how these allocations are ranked depends on the functional form of the social welfare function. So far, we assumed an additive structure: Lisa's and Tom's utility are perfect substitutes.
We could also assume a multiplicative structure, in which case Lisa's and Tom's utility are supplements, and inequality is penalized. This is typically true in real life, since there are diminishing marginal returns to the enjoyment of almost everything; a poorer person values an extra euro more than a rich person does. In this case, the third allocation maximizes the social welfare at the daycare center:
\begin{equation*}
\text{Lisa: B,P; Tom:} \emptyset \quad \Rightarrow \quad
W = u_L(P,B) \times u_T(\emptyset) = (5+2) \times 0 = 0
\end{equation*}
\begin{equation*}
\text{Lisa: B; Tom: P} \quad \Rightarrow \quad
W = u_L(B) \times u_T(P) = 2 \times 2 = 4
\end{equation*}
\begin{equation*}
\text{Lisa: P; Tom: B} \quad \Rightarrow \quad
W = u_L(P) \times u_T(B) = 5 \times 2 = 10
\end{equation*}
\begin{equation*}
\text{Lisa: } \emptyset; \text{Tom: B,P} \quad \Rightarrow \quad
W = u_L(\emptyset) \times u_T(P,B) = 0 \times (2+2) = 0
\end{equation*}
According to the second welfare theorem, each Pareto optimum can be achieved via a competitive equilibrium, if lump-sum taxes and transfers are available to shift individual endowments. For instance, if initial endowments yield point A in the figure above and our social welfare function prefers point B, we can impose a lump-sum tax on individual 2 and give it to individual 1 to induce this shift in the resulting equilibrium.
In the daycare example, if Lisa decided to take the book and the puzzle (allocation 1), the teacher could intervene and take the book away from Lisa to give it to Tom (allocation 2), thereby shifting between two Pareto efficient allocations to achieve the one that is socially optimal.
Unfortunately, in practice, the government’s ability to use lump-sum taxes to improve the distribution of resources in a society is limited. A lump-sum tax is a fixed amount that individuals pay based on their characteristics, independent of their choices. For example, imagine an economy with 10 persons, of whom 5 have an initial wealth of €100, while the other 5 have an initial wealth of €0. Assume that social welfare would be maximized if those with €100 paid €50 to those who do not have anything.
However, this reallocation may eliminate the individuals' incentives to generate future wealth, if all gains are redistributed to be shared equally independent of each individual's work effort. Moreover, the information on the initial wealth may not be directly observable to the government.
Good to Know
In practice, government decisions are rarely made in situations where Pareto improvements are feasible. Most often, the government will face a trade-off between different groups' needs and interests, and the implications of different decisions on aggregate welfare may not always be clear.
For example, assume that the government is considering building a new highway. Those wanting to use the highway to arrive at work faster or transport their products quicker are willing to pay a user fee, which would cover the costs of construction and maintenance. At first glance, the construction of this highway may appear to be a Pareto improvement: It will clearly make some individuals better off.
But, there will most likely also be individuals who are adversely affected by the highway. Traffic delays and congestion may bring negative side-effects during construction, and entire neighborhoods may remain negatively affected by the noise from the highway. In this case, it may still be possible for the government to reduce the negative effects (e.g., build a noise protection wall) and/or compensate those who remain negatively affected.
Balancing conflicting interests will be yet more challenging in times of major crises, as the COVID-19 pandemic highlighted. Strategies used to manage public health risks themselves pose risks. The healthcare sector faced risks in non-pandemic areas due to the diversion of resources to treat and fight COVID-19. Meanwhile, businesses, potential victims of domestic violence, and children's education are all areas where pandemic response protocols may have complicated a situation and made some groups relatively worse off than the average.
Expert advice can help to clarify some of these trade-offs, but comparing the individual gains and losses arising from each policy option, and finding the socially optimal solution, will be less straightforward than the simple examples introduced above may suggest.
-
- Researcher / Analyst Job
- (Hybrid)
- Posted 2 weeks ago
Wissenschaftliche:r Mitarbeiter:in Metascience in Economics
At ZBW Leibniz Information Centre for Economics in 2911298, Germany and Kiel, Germany
-
- Assistant Professor / Lecturer Job, Professor Job
- Posted 1 week ago
Professor or Associate Professor or Associate Professor (Lecturer) Tenure-track position
At The University of Osaka in Osaka, Japan
-
- Assistant Professor / Lecturer Job
- Posted 2 weeks ago
Assistant Professor - Economics
At Salisbury University in Salisbury, United States
Currently trending in United States

Related Items


Featured Announcements


Upcoming Deadlines
- Jul 26, 2026
- Jul 26, 2026
- Jul 29, 2026
- Jul 31, 2026
- Jul 31, 2026


